
CFO IT Spend Accountability: Build the Record

Table of Contents
- Quick answer: Proving IT spend value
- What Did Last Year’s Technology Money Buy? The CFO IT Spend Accountability Test
- An Unproven Success Teaches the Organization Nothing
- Where the Value Leaks: Three Stages, Three Different Failures
- Released Capacity Is Not Value Until the P&L or the Queue Changes
- Build the Value Ledger Without a PMO
- One Owner, One Date, One Review at Ninety Days
- The Statistic We Will Not Use
- Frequently Asked Questions
Your next IT request gets cut because nobody can show what the last one produced. The last project probably worked. The record of it doesn’t exist. CFO IT spend accountability comes down to a one-page ledger per project: a baseline captured before the work, three to five measures, one owner and one date for each, and a review ninety days after launch.
Picture a hypothetical 200-person distributor in the December budget meeting. The CTO asks for $400,000 to extend last year’s order-system rebuild. The CFO asks the fair question: what did the first round buy? The CTO says cycle times improved. Operations agrees it feels faster. Nobody has a number. The request drops to $150,000, and the CTO leaves with a story instead of a result.
That gap is fixable without a new department. Write down what success looks like before the money moves, and modernization ROI becomes something you can show a board instead of something you describe.
Quick answer: Proving IT spend value
- Your next IT request gets cut when nobody can show what last year’s spend produced.
- Value leaks at three points: target setting, implementation, and after go-live.
- Freed capacity isn’t value until the P&L or the work queue changes.
- Capture a baseline first, track three to five measures, and give each one an owner and a date.
- Review at ninety days, and write the one-page record even when the result is mixed.
What Did Last Year’s Technology Money Buy? The CFO IT Spend Accountability Test
The honest answer in most mid-market budget meetings is a story and a feeling. The project shipped, people seem happier, and nobody can attach a number to either. Better slides won’t fix that. A measurement gap needs a measurement.
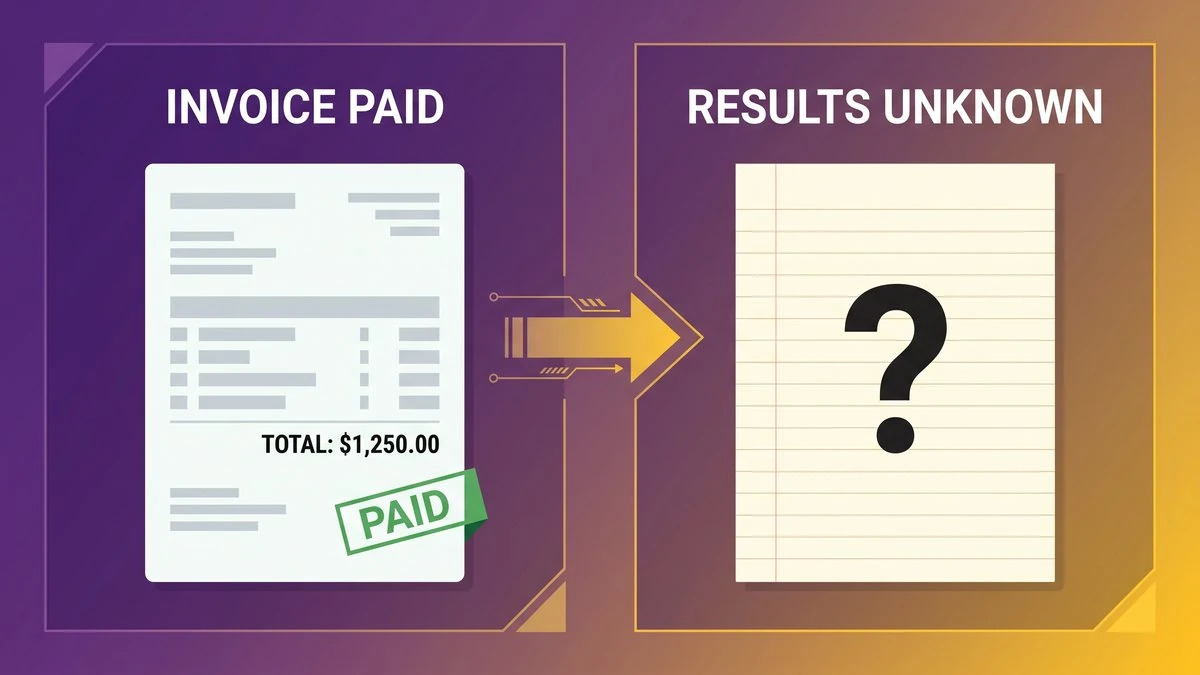
A CFO reviewing an IT budget request when no record exists of what the previous project delivered.
The request is reasonable, the sponsor is credible, and it still gets cut
Nothing is wrong with the person asking. The CTO is competent, the system needed the work, and the CFO isn’t hostile. The CFO is doing the job: weighing a request against what the company already knows. What it knows is a signed invoice and a forecast full of adjectives. “Significant efficiency gains” can’t be audited. A $600,000 invoice can.
So the request gets trimmed, deferred, or split into phases that guarantee nobody finishes. The CFO made a defensible call on the only data in the room. Your job is to put better data in the room. IT spend visibility starts with what the money bought, and only then with what it cost.
An Unproven Success Teaches the Organization Nothing
A visible failure at least teaches something. An unproven success teaches nothing and earns no credit. A company with no record gets judged on its forecast every time, and a forecast always loses to a contract.
A contract has a number, a signature and a penalty clause. A forecast has a slide. When the CFO weighs the two, the fact that your last project worked stays invisible, because nothing you kept can show it.
And “worked” is rarely clean. As Michael Bucy, Bill Schaninger, Kate VanAkin and Brooke Weddle write in McKinsey’s 2021 study Losing from day one: “Respondents reporting success estimate that, on average, their organizations have realized only 67 percent of the maximum financial benefits that their transformations could have achieved.” Respondents at every other company put the figure at 37 percent. Even the winners left a third on the table, and without a record you can’t tell which third.
Boards have learned to discount accordingly. BCG’s September 2025 analysis found that fewer than one in three transformations reach their intended outcomes. A director who has seen that rate marks down every forecast she’s handed, yours included. Only a track record gets past the markdown.
We’d take a documented mixed result over an undocumented win every time. The mixed result gives the CFO something to check. The win gives them a story. A one-page record per project also turns board IT reporting from a defense into a five-minute agenda item.
Where the Value Leaks: Three Stages, Three Different Failures
Value leaks at three points: when the target is set, while the work is underway, and after go-live. Each has a different cause, so a single fix like a better dashboard rarely closes the gap.
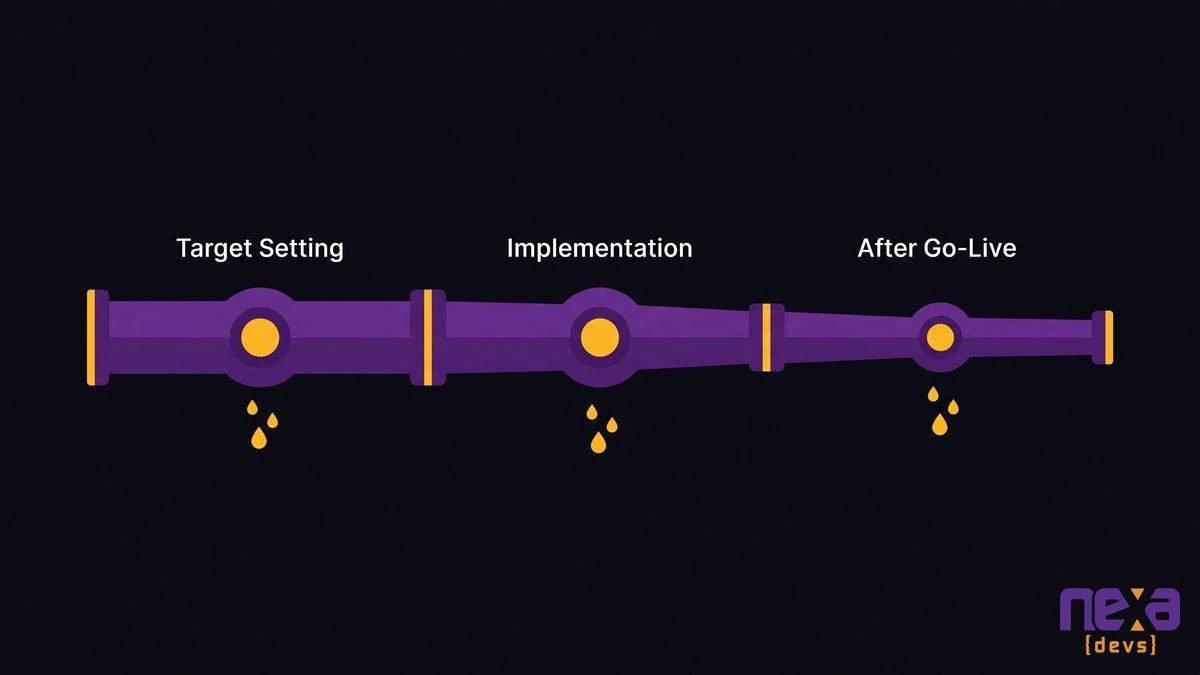
Value leaks at three stages of an IT project, and each stage has its own cause.
At target setting: the estimate was never written down in a form anyone could check
An estimate that reads “meaningful savings in order processing” can’t be wrong, so it can only fade. McKinsey’s 2017 study of 18 transformations at 13 Asia-Pacific organizations found the initial impact estimate fell by about 45 percent at the first handoff alone. By the time the value was expected to show up in cash flow, the original estimate had dropped about 70 percent cumulatively.
Read that as a map of where value disappears, not as a forecast for your project. The sample is small and regional. The mechanism still travels: estimates shrink at every handoff that nobody has to defend. The defense is a target written as a number, a unit and a date. “Cut order-to-ship from five days to two by March 31” survives a handoff. “Faster fulfillment” doesn’t.
During implementation: scope gets traded away quietly
Deadlines force trades. The team drops the approval-routing feature to hit the launch date, and nobody records that the feature carried half the projected savings. Each trade is reasonable on its own. Together they hollow out the business case.
The fix costs almost nothing. When scope changes, someone rewrites the target line and says so out loud. If the savings number moved, the sponsor hears about it in the same meeting the feature gets cut.
After go-live: the measurement has already stopped
The project team disbands, the sponsor moves to the next priority, and the dashboard nobody owns goes stale. According to McKinsey’s 2021 survey, respondents say 20 percent of value loss occurs after implementation is complete. That’s a share of the value lost, not a fifth of the project’s total value, and nobody is watching it.
Technology adoption after implementation drives much of it. If half the team drifts back to the old spreadsheet, the new system’s savings never appear anywhere. You can’t see that drift without a number taken months after launch.
Released Capacity Is Not Value Until the P&L or the Queue Changes
Two engineers freed by automation aren’t a saving. They’re a decision waiting to be made. Until a budget line shrinks or a backlog item ships, the business case for modernization has delivered nothing you can bank.
Suppose the case said the rebuild would free two engineers from weekly patching. A year later, both sit in the same seats working the same maintenance tickets. Nobody did anything wrong. The decision was never made. The capacity exists, and it’s being spent on the old work by default.
Three decisions would turn that capacity into value. Leave the next departure unfilled and a budget line shrinks. Put both engineers on a named backlog item with a delivery date, and the queue moves. The third is an invoice: stop paying a contractor for work the team can now absorb, and that shows up in the P&L too. Each one answers the same question. Which line shrank, or which item shipped?
The decision belongs to the business side, because engineers can’t cut a budget line and only the person who owns the budget can. It’s the one place the CFO and the CTO have to sit in the same room.
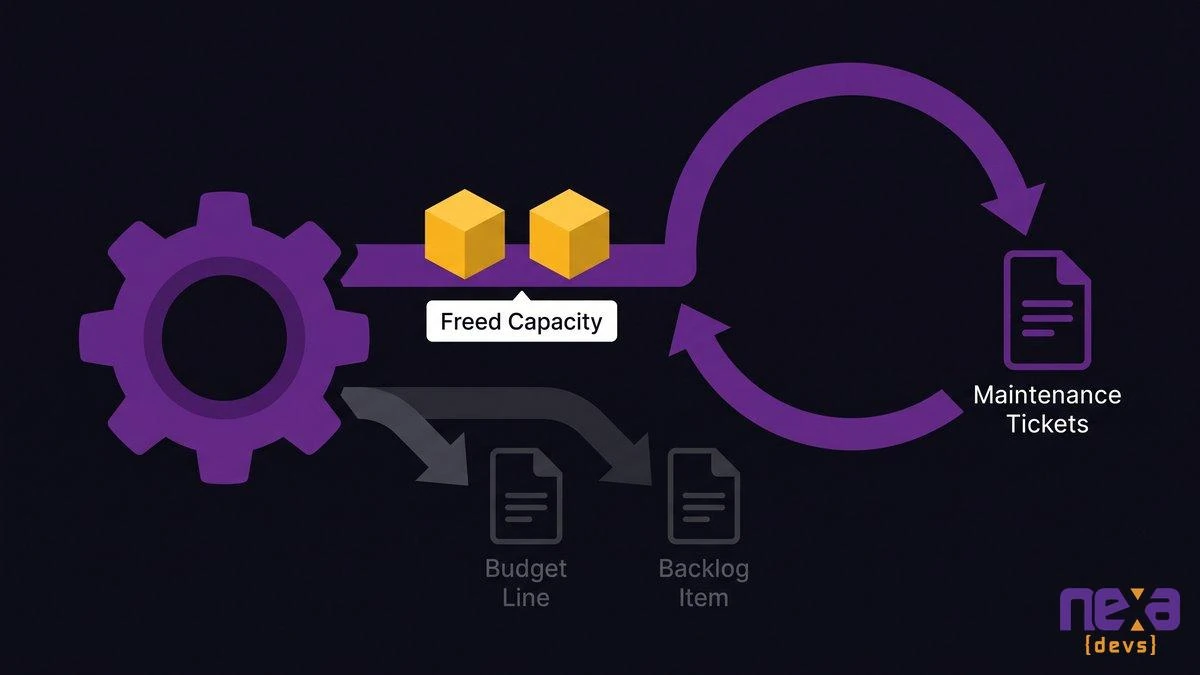
Released capacity stays invisible until someone decides where it goes.
If you’re scoping a modernization now, our legacy system modernization team can help you write the targets before the first sprint starts.
Build the Value Ledger Without a PMO
A value ledger is one page per project: a baseline, three to five measures, an owner and a date for each, and the result. One person with a day job can run it in a spreadsheet. IT value realization at 200 people doesn’t take a department.
We’re not pitching a PMO, a value realization office, a governance layer, or a benefits realization tracking platform. A company this size can’t staff them, and a platform nobody feeds becomes one more stale dashboard. We’re also not arguing that your last vendor failed. It probably delivered. You just can’t prove it yet.
Set the baseline before the work starts, because it cannot be reconstructed afterward
Capture four numbers before the first sprint: hours per cycle on the affected process, time from request to production, count of manual handoffs, and the annual cost of the thing being replaced. Once the new system goes live, the old process disappears. Memory of how bad it was drifts, usually toward kinder.
Skip the baseline and the “after” number has nothing to compare against. Capturing it takes an afternoon with the process owner, and without that afternoon you have an anecdote instead of a number. It’s also the only way to audit IT spending against something other than a promise.
Pick three to five measures and refuse the rest
Every stakeholder will suggest a metric. Refuse most of them. In McKinsey’s 2017 program data, only 29 percent of the metrics organizations claim to follow are actively used during the project. The same Asia-Pacific sample applies, so treat it as a pattern in how programs behave. The other 71 percent are decoration.
Choose measures that map to the P&L or the queue: hours per cycle, request-to-production time, rework from errors, annual run cost of the replaced process. If a measure can’t change a decision, drop it. When every past project carries the same three numbers, you can prioritize spending based on ROI instead of on who presents best.
One Owner, One Date, One Review at Ninety Days
Every measure gets one named person and one calendar date. The review happens ninety days after launch, and the result goes on a single page whether it’s good, bad, or mixed. You can delegate all of it on Monday.
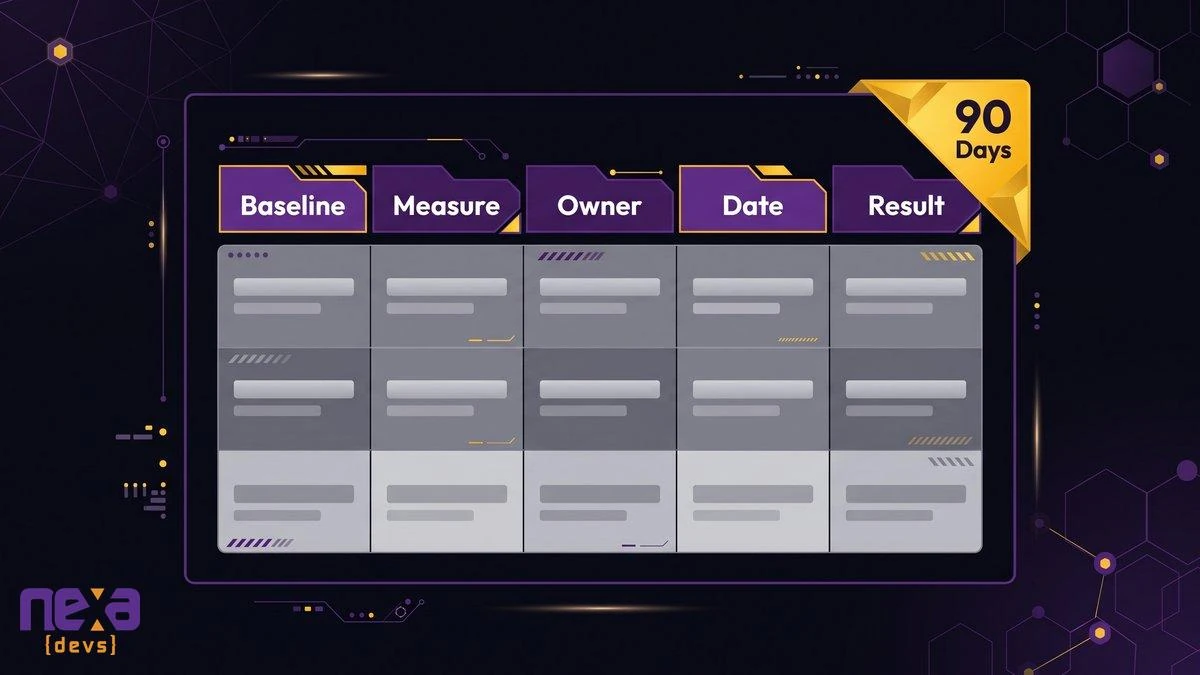
A one-page value ledger: baseline, measure, owner, date, and the result at ninety days.
An unowned number is a number nobody will produce
“The ops team will track it” means nobody tracks it. Pick the person whose P&L or queue moves: the warehouse manager owns cycle time, the controller owns annual run cost. Write the date on the ledger itself.
On the delivery side, the dedicated project manager Nexa assigns to every engagement can own the build-phase numbers and keep the baseline stable while scope shifts. Name the person, write the date. A committee will hand you minutes and no number.
Why launch day is the wrong review date
Launch day is where the plan ends and nothing has been measured yet. It’s all promise. Ninety days later, users have run real cycles, and the workarounds have either died or crept back. That’s when a post-implementation review has real data to read, and it’s when you catch the loss McKinsey’s survey places after go-live.
For a mid-market company that’s the whole technology investment review: an hour on the calendar and a single page. Somebody has to be there at day ninety, though. Under Nexa’s SLA-based support the engineers who built the system are still around, and every project includes a month of free post-launch support, so someone is watching the first live cycles.
Write the one-page record even when the result is mixed
The page holds the baseline, the target, the result, any scope changes, and the one decision the result triggers. A mixed result reads like this: “Order-to-ship fell from five days to three, not two. The second approval step stayed manual. We’re funding that fix next.”
That page builds credibility, because it shows the company checks itself. Next year’s request arrives with a history attached. On our engagements we hand sprint documentation, roadmap artifacts and milestone records to the client as standard practice, so the scope history already exists. AI-assisted requirements analysis and effort estimation get the baseline numbers on paper at the start, and they’re still comparable at the end.
The Statistic We Will Not Use
You’ve probably heard that 70 percent of change initiatives fail. We won’t use that number, because it has no reliable empirical basis.
Mark Hughes of the University of Brighton reviewed five published sources of the claim in the Journal of Change Management (volume 11, issue 4, 2011). He found no valid and reliable empirical evidence to support it. The number circulates because it’s memorable, and it’s memorable because it’s frightening.
Scary numbers are cheap. A CFO who spots one inflated figure in your deck discounts the rest of it. So every figure above comes with a named source, a sample, and a limit. McKinsey’s 2017 findings cover 18 transformations at 13 Asia-Pacific organizations. Its 2021 figures are self-reported by 1,034 survey respondents. They show where value goes missing. They don’t predict your project.
The point isn’t to justify last year’s project but to stop walking into the next budget conversation with no history. Start with the project you just finished. Recover the baseline you can, measure what’s measurable today, name an owner, and set a date ninety days out. A partial record beats none.
Frequently Asked Questions
What should be included in a post-implementation review?
Four things: the baseline, the original target, the measured result, and any scope changes made along the way. Add the one decision the result triggers. Keep it to one page with one named owner.
What is a benefits realisation process?
It’s the routine of setting a measurable target before a project, tracking it after launch, and checking the result against the original number. For a mid-market company, a one-page ledger and a ninety-day review cover it.
What is benefits realization management?
It’s the discipline of making sure a project’s promised benefits actually show up in the P&L or the work queue. Large enterprises run it through a PMO. A 200-person company can run it with one spreadsheet and named owners.
What does “benefit realization” mean?
It means the promised benefit has actually happened and you can show it. Freed engineering hours don’t count until a budget line shrinks or a backlog item ships.
What is a PIR in tech?
A PIR is a post-implementation review: a structured look back after a system goes live that compares results against the original goals. Run it at ninety days, not at launch, so real usage data exists.
What are the top KPIs for a CFO?
For technology spend, track three to five: hours per cycle on the affected process, request-to-production time, manual handoffs, and the annual cost of what the system replaced.
If you’re about to write next year’s request, we can help you set the baseline before the first sprint begins. Schedule a call with Nexa Devs.