
Table of Contents
Legacy System Maintenance Cost 2026: Why Your Bill Keeps Growing
Your IT maintenance budget went up again. Not by a small amount, and not because your team made bad decisions. It went up because the system underneath the budget is designed to increase: every year, automatically, whether you act or not.
That’s the part most cost breakdowns miss. They treat legacy system maintenance costs as a line item to monitor. It’s not. It behaves like compound interest. Each year of delay adds to the principal, and the following year’s costs accrue on top of that. The maintenance tax is compounding, and most mid-market CEOs and CFOs are measuring it the wrong way.
This guide breaks down what’s actually driving the 2026 cost increase: the direct costs, the hidden multipliers, the COBOL scarcity curve, the compliance exposure. It also gives you the financial framing to model it as what it is: a liability, not a line item.
The Maintenance Tax Is Not a Line Item: It’s a Compound Interest Problem
Your maintenance budget from last year is the floor this year. Not the ceiling.
Most budget conversations skip this entirely. Legacy maintenance costs don’t plateau; they escalate. Each year you carry an aging system, three compounding forces add to the base cost: technical debt accumulates (every patch creates two new friction points), specialist talent becomes scarcer and more expensive, and compliance requirements increase in scope. None of these forces are linear. They compound on each other.
Why last year’s maintenance budget is already the floor, not the ceiling
Think about what happened to your system over the past 12 months. A developer patched a performance bottleneck and introduced two undocumented workarounds. An integration with a third-party vendor broke, and someone built a manual export process as a temporary fix that is now permanent. A compliance update required a configuration change that nobody fully tested. Each of these events adds debt to the principal. Next year, maintaining the same system costs more because there’s more of it to maintain.
What that means in practice: if you budgeted $800,000 for legacy maintenance this year and your system is five years past its original design horizon, you are not looking at $800,000 next year. You are looking at $900,000 to $960,000, before any new compliance requirements land, before your senior COBOL contractor retires, before the next integration breaks. The budget is not stable. It is a moving floor.
The three stacking forces: COBOL scarcity, compliance pressure, and integration debt
These three dynamics don’t operate independently.
COBOL developer scarcity shrinks your talent pool every year and pushes rates higher. Compliance pressure adds surface area to your maintenance scope with every new regulation. Integration debt multiplies the cost of both, because a fragmented, tightly coupled system takes longer to patch, longer to audit, and longer to test than a clean one. When you’re paying a scarce specialist $200 per hour to work through an undocumented spaghetti integration, all three forces are billing simultaneously.
The compounding mechanism is not theoretical. It shows up in budget actuals. And it accelerates.
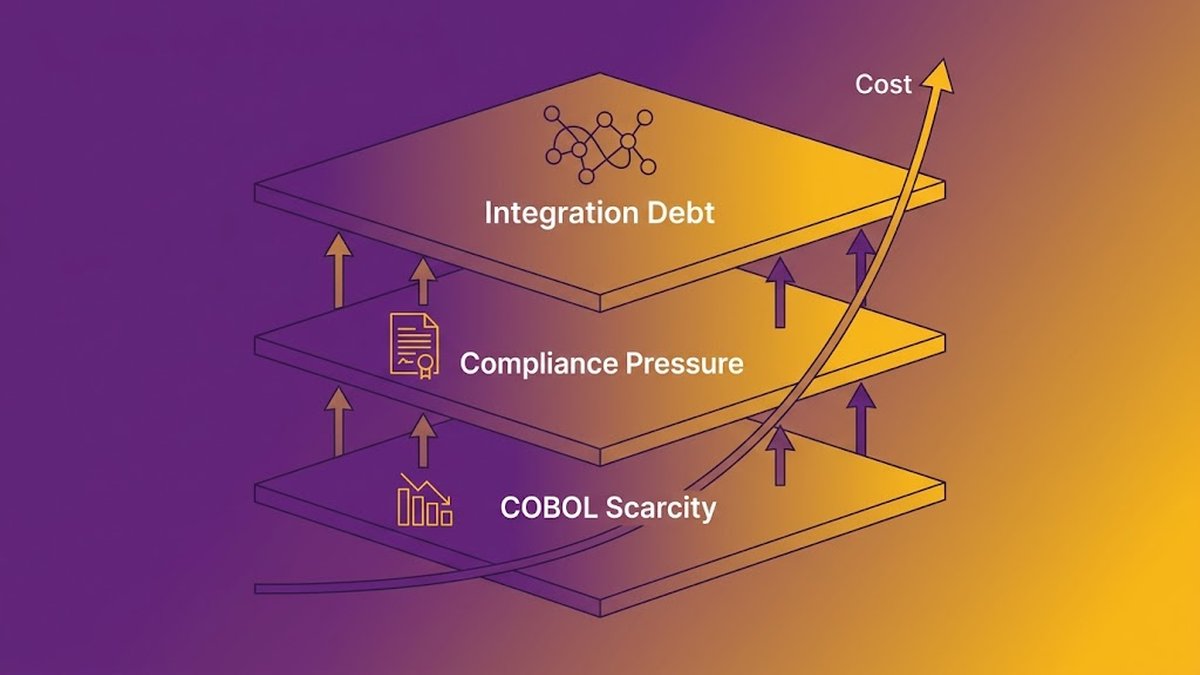
The three forces: developer scarcity, compliance pressure, and integration debt stack on each other annually. The result is a cost curve, not a flat budget.
What the Numbers Actually Say: Breaking Down the Full Cost of Legacy Maintenance
The published benchmarks on legacy maintenance costs are wide. The reason isn’t that the data is poor; it’s that most organizations are only counting the visible costs.
Direct costs: infrastructure, licensing, and specialist labor
Direct costs are the ones that appear in the IT budget: infrastructure support contracts, software licensing fees, and the labor cost of maintaining the system. For a mid-market organization running 10-15 legacy applications, the direct maintenance cost alone runs $400,000-$800,000 annually. When you add indirect costs (productivity loss, downtime, opportunity cost) that figure grows substantially.
The Accenture figure most frequently cited puts tech debt consequences at $2.41 trillion annually across the US economy. That’s a macro number. The mid-market equivalent is more actionable: analysts at zazz.io put the total annual cost of technical debt for a 20-person engineering team at $3.6 million per year, accounting for direct maintenance, velocity drag, and opportunity cost.
Indirect costs: productivity loss, downtime, and opportunity cost
Indirect costs are where the real damage accumulates. Engineers working in legacy codebases spend 25-40% of their capacity on maintenance rather than new development. That’s not a productivity problem you can hire your way out of; it’s a structural drain that compounds as the codebase ages.
Downtime is the most visible form of indirect cost, but opportunity cost is higher. Every feature your team can’t ship because they’re patching the existing system is a competitive gap. Every AI capability you can’t build because your data is locked in a system that doesn’t expose clean APIs is a compounding disadvantage. These costs don’t appear in the IT budget. They appear in revenue growth rates and win/loss reports.
The 60-85% IT budget benchmark and what it means for your innovation budget
The most cited benchmark in this space puts legacy-heavy organizations allocating 60-80% of their IT budgets toward maintaining existing systems rather than building new capability. The CIO Dive figure from 2025 is specific to banking: 43% of IT budgets going to legacy maintenance, 29% to transformative technology. The pattern holds across sectors.
Ray Forte, an executive at Analog Devices, described their situation plainly: “The first thing we did was calculate what percentage of our investment would be needed to keep the lights on. It was in the low 80s.”
That’s the math problem. When 80% of your budget is keeping existing systems alive, you have 20% left for everything else: new products, AI integration, competitive differentiation, and the modernization you keep deferring. The maintenance tax doesn’t just cost you money. It costs you the ability to do anything else.
The COBOL Clock: Why Developer Scarcity Is the Fastest-Compounding Cost Driver
COBOL isn’t dying slowly. The retirement clock is running on a known schedule, and the talent pool is shrinking at a measurable rate.
Average age and annual retirement rate of the COBOL workforce
According to the Open Mainframe Project’s Systems Journal analysis, the average age of a COBOL programmer is 58, with approximately 10% retiring each year. That figure is from 2020, which means in 2026, you’re looking at a cohort that is, on average, six years older and six annual cohort-retirement cycles further into depletion. The same analysis estimated that there were 84,000 unfilled mainframe COBOL positions. Those positions aren’t waiting to be filled. They’re being absorbed by contract work at escalating hourly rates.
The trajectory is visible. As each retirement cohort exits the workforce, the remaining practitioners gain pricing leverage. They’re not competing with a large talent pool. They know it, and the rates reflect it.
Contractor rate escalation: from $120/hr in 2022 to $180-$250/hr in 2026
Specialized COBOL contractors now command $180-$250 per hour, up from approximately $120 per hour in 2022. Even if the specific rate range requires verification against a primary source, the trend itself isn’t in dispute: every reduction in supply with stable or growing demand produces rate inflation. And COBOL demand is not shrinking. Mordor Intelligence puts the global legacy modernization market at USD 29.39 billion in 2026, up from USD 24.98 billion in 2025. Organizations are not walking away from legacy systems; they’re paying more to maintain them.
For a mid-market organization with a COBOL-dependent system that requires 1,000 hours of specialist contractor time per year, the shift from $120 to $200 per hour is a $80,000 annual increase on that single cost line. That number will be larger next year.
What happens when your last institutional-knowledge holder retires
The COBOL scarcity story has a harder version that most cost analyses don’t address: what happens when the person who knows your system (not just the language, but the specific business logic baked into your configuration over 15 years) decides to retire.
This isn’t hypothetical. Organizations routinely find themselves in situations where a single contractor or employee holds all meaningful knowledge of a system’s behavior. When that person leaves, the system doesn’t stop running. It just becomes unmaintainable by anyone else. You can hire a COBOL contractor at $250 per hour to keep the lights on, but they’ll spend a significant portion of that time reverse-engineering what the previous person knew and never documented. You’re paying discovery rates for maintenance work.
The cost isn’t just the replacement rate. It’s the discovery premium on top of it, plus the operational risk of running a system nobody fully understands.
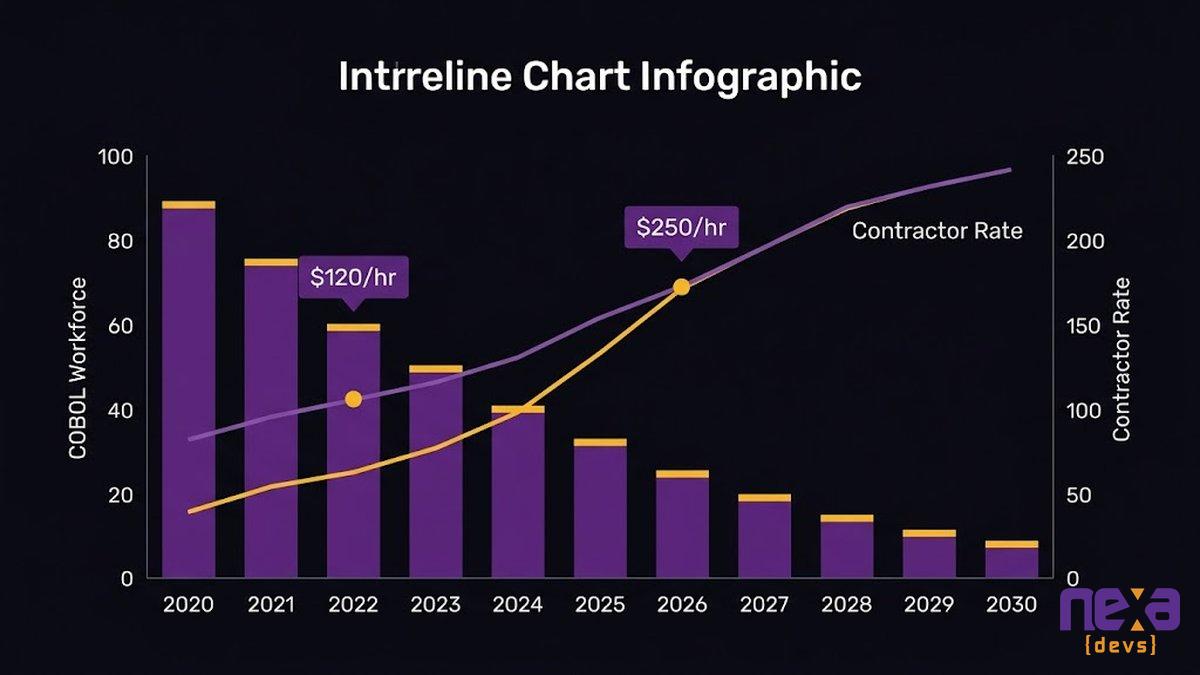
As the COBOL workforce shrinks roughly 10% per year, contractor rates rise in inverse proportion. The two curves cross at an accelerating rate.
The Cost-of-Delay Equation: How One Year of Inaction Changes the ROI Math
Most modernization cost analyses model one variable: the cost of modernization. They compare the modernization price tag against the current maintenance budget and calculate a break-even point. That’s a useful exercise, and also an incomplete one.
The complete model has two variables: the cost of staying and the cost of leaving. Both increase over time.
Modeling the compounding maintenance tax: year 1 vs year 3 vs year 5
Start with a simplified scenario. Your legacy system costs $900,000 per year to maintain in direct and indirect costs. You have a modernization path priced at $1.2 million. The simple break-even math says: modernize, recover the investment in 16 months, and your annual cost drops to the lower run-rate of the modernized system.
But that math assumes the $900,000 is static. It’s not. At a conservative 12% annual cost increase (below the 18-25% figure attributed to 2026 trends, and pending verification on a primary source), your maintenance cost in year 3 is $1.128 million. In year 5, it’s $1.416 million. The break-even point that looked achievable in year 1 gets harder to reach every year, because the principal keeps growing.
Why modernization also gets more expensive the longer you wait
Compounding works in both directions. Each year of maintenance adds complexity to the legacy system: more undocumented workarounds, more patches on patches, more integrations that will need to be untangled during modernization. The $1.2 million modernization scoped in year 1 is a $1.5 million modernization in year 3, because the system is harder to map and migrate. And the team with the institutional knowledge to guide that modernization is smaller, because your best COBOL specialist retired in year 2.
This is the dynamic no competitor article models completely: maintenance cost and modernization cost escalate in parallel. Delaying action doesn’t buy time. It raises both invoices.
The break-even crossover point for mid-market organizations
For a mid-market organization running 10-15 legacy applications, the break-even crossover (the point at which annual maintenance costs exceed the annualized cost of incremental modernization) typically occurs between 18 and 30 months after the decision point, depending on the rate of cost escalation
Organizations that cross that threshold without acting aren’t negligent. They’re being overwhelmed. The decision feels risky because modernization carries visible execution risk. Maintenance feels safe because the existing system still runs. The compounding mechanism is invisible until the break-even crossover is in the rearview mirror and the budget is no longer recoverable within a reasonable planning horizon.
Security and Compliance: The Hidden Cost Multiplier Nobody Budgets For
Security and compliance costs don’t appear in the initial legacy maintenance budget. They show up as emergency line items after an audit, a breach, or a regulatory change. And they’re getting larger.
End-of-life systems and the compliance exposure risk
Systems running on end-of-life infrastructure (software versions no longer supported by vendors, hardware beyond warranty, databases with no active security patching) carry compliance exposure that is difficult to quantify in advance and expensive to address reactively. When a regulation changes or a vendor audit flags your infrastructure, the cost of emergency remediation is multiples of what proactive remediation would have been.
Premium support for end-of-life systems costs 50-200% more than standard support, depending on the vendor and platform. Organizations running unsupported databases or operating systems are either paying that premium or accepting the compliance exposure as an unhedged risk.
Regulatory penalty exposure vs. patching cost escalation
The regulatory environment for data-handling systems tightened significantly in 2025-2026 across healthcare, financial services, and other organizations that process personal data. The practical consequence for organizations running legacy systems: every new regulation adds surface area to the compliance audit, and legacy systems fail those audits at higher rates than modern ones because their data handling was never designed for current requirements.
The cost math here is asymmetric. The cost of a proactive compliance-driven patch to a legacy system is known and containable. The cost of a regulatory penalty, a breach, or a failed audit is not. The IBM Cost of a Data Breach 2024 report puts the average breach cost at $4.88 million. That’s a single event. For a mid-market organization, it’s existential.
Compliance isn’t an IT risk. It’s a balance-sheet risk wearing an IT costume.
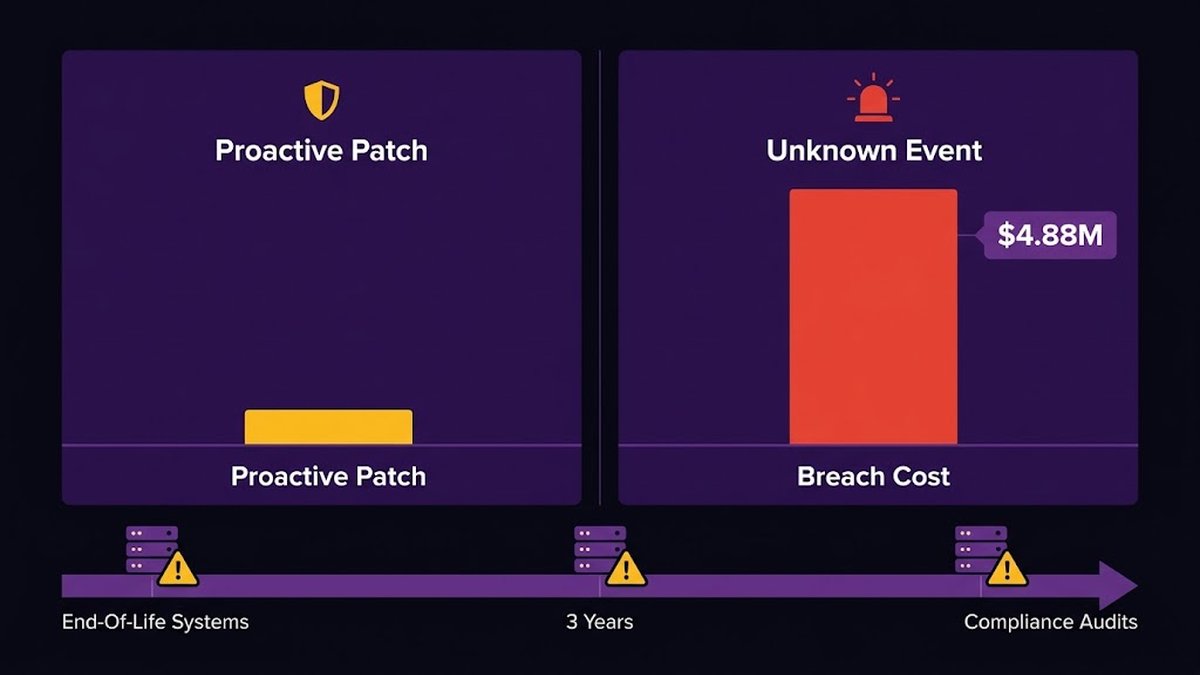
Compliance costs for legacy systems scale with both the system’s age and the pace of regulatory change. Both are accelerating.
Why Full Rewrites Make the Cost Problem Worse Before It Gets Better
When the maintenance tax becomes visible, the instinctive response is a big-bang rewrite: retire everything, rebuild from scratch, start fresh. It’s emotionally satisfying. It’s also, in most cases, the wrong financial decision.
A full rewrite doesn’t eliminate the maintenance cost immediately. It adds the rewrite cost on top of the maintenance cost for the duration of the program, then defers the financial benefit to completion. That typically arrives 36-48 months after the decision. During that window, you are paying twice: once to keep the legacy system running because you can’t turn it off mid-rewrite, and once to fund the rewrite itself.
Big-bang rewrite failure patterns and budget overrun statistics
The failure pattern is well-documented. 70% of modernization programs exceeding budget by 30% or more; original source flagged as low-quality in brief; use directionally only. The reasons aren’t random: big-bang rewrites require a complete, stable requirements set at the start of a multi-year program, which no mid-market organization actually has. Requirements change as the business evolves. The rewrite chases a target that moves. Budget overruns accumulate. The program gets descoped. The delivered system solves the problem as it was understood 18 months ago.
The opportunity cost of a 36-48 month modernization program
While the rewrite runs, your competitors aren’t pausing. Every month your engineers are focused on rebuilding existing functionality instead of shipping new capability is a month the competitive gap widens. And if you’re counting on the rewrite to give you AI integration capability (to build the clean data pipelines and API-first architecture that AI requires), you’re deferring that capability by 36-48 months, into a market that will not wait for you.
As Skylar Roebuck, CTO at Solvd, stated: “Traditional modernization tends to over-index on protecting how things work today rather than building for what’s next. AI capability is compounding rapidly, and the real risk for mid-market companies is delay.”
The rewrite protects today. Incremental modernization builds for what comes next while reducing the maintenance tax along the way.
Why incremental modernization is not a compromise: it’s the financially superior path
Incremental modernization has a shorter payback timeline. Studies on phased modernization approaches cite payback periods in the 6-18 month range for targeted incremental work, versus 36-48 months for full rewrites. payback range is directional; primary source required before publishing. The reason: incremental work delivers financial benefit at each phase completion rather than deferring it to a program-end milestone that may never arrive on schedule.
The Deloitte 2023 analysis found that phased modernization approaches delivered a 25-40% reduction in IT operational costs over three years. Full-rewrite programs that overrun budget and scope deliver no cost reduction until completion, and frequently don’t reach completion on the original terms.
Incremental modernization is a financial strategy, not a technical compromise. The math supports it.
The 90-Day First-Win: How Incremental Modernization Starts Shrinking the Tax Immediately
The first objection to incremental modernization is always timing: “We can’t start until we have a complete roadmap.” The second is sequencing: “Where do we begin if we’re not replacing everything?” Both objections disappear when you have a cost map.
Mapping the legacy cost structure before any code changes
Before any code changes, the highest-value activity is a structured legacy cost assessment: which applications consume the most maintenance budget, which carry the most compliance exposure, and which have the smallest developer knowledge base. This is not a technical audit. It’s a financial inventory.
AI-augmented delivery methodology cuts this process from months to days. AI-assisted code analysis maps undocumented dependencies, identifies the most fragile integration points, and surfaces the applications with the highest maintenance-cost concentration. The output isn’t a technical spec. It’s a ranked list of cost drivers with dollar amounts attached.
With that list, the CEO and CFO can see exactly where the maintenance tax is concentrated and which applications, if modernized first, would produce the fastest cost reduction. The decision shifts from technical to financial.
Prioritizing the highest-cost applications first
Most organizations running 10-15 legacy applications find that 2-4 of them account for 60-70% of the total maintenance cost. The rest are expensive but manageable. Incremental modernization that targets those 2-4 applications first produces a disproportionate cost reduction relative to the scope of work.
This is the 90-day first-win logic: instead of committing to a multi-year program, commit to a 90-day assessment and prioritization phase. At the end of 90 days, you have a ranked cost map, a business case with ROI math for the first modernization target, and a decision point rather than a contract for a three-year program you haven’t fully scoped.
What a realistic 90-day payback looks like at mid-market scale
A realistic 90-day outcome for a mid-market organization is not a completed modernization. It’s a cost map, a prioritized modernization backlog, and a first-sprint delivery on the highest-cost application: enough to demonstrate that the maintenance tax on that application is decreasing before you commit to the next phase.
For a $900,000 annual maintenance budget concentrated in 3-4 high-cost applications, a 90-day initial phase that reduces the cost of the first application by 30-40% delivers $80,000-$120,000 in annualized savings. That’s not the full modernization. It’s the proof point that makes the next phase an easy internal approval.
AI legacy modernization strategy
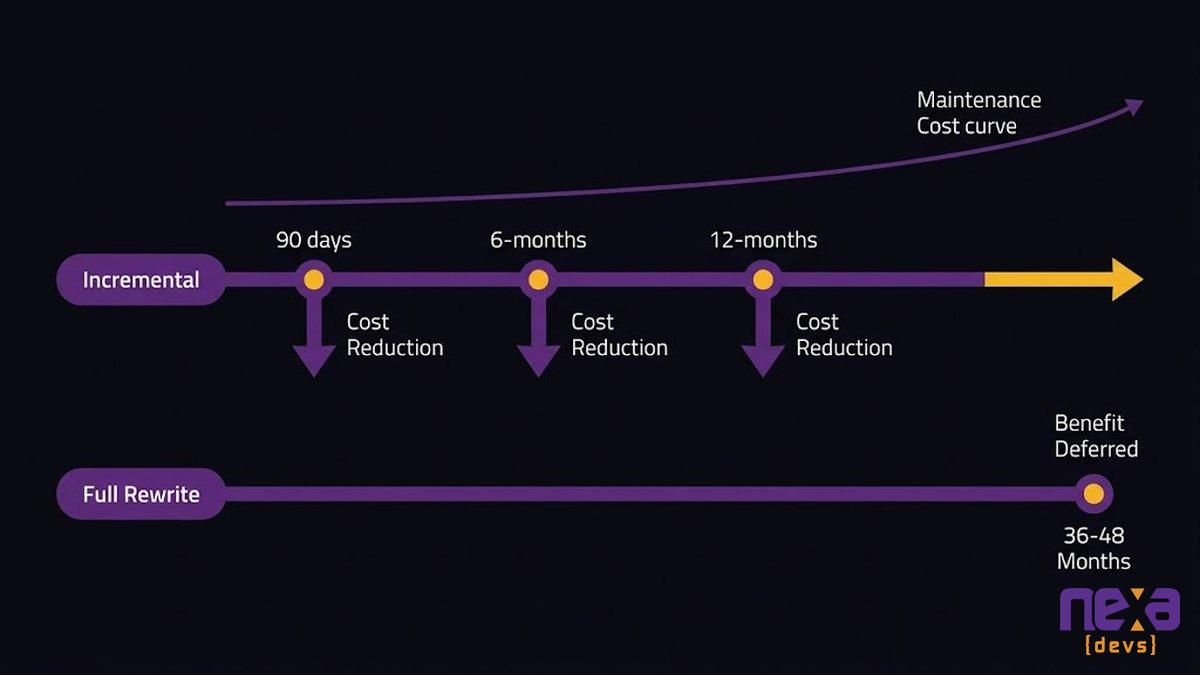
Incremental modernization produces financial benefit at each phase. A full rewrite defers all benefits until completion, a milestone that routinely slips by 12-18 months.
Building the Internal Business Case: How CFOs Can Model the Compounding Maintenance Tax
The maintenance tax conversation fails internally when it’s presented as a technical problem. It succeeds when it’s presented as a financial liability with a compounding rate and a known cost of delay.
Here’s the framework.
The five inputs every CFO needs for a legacy cost model
1. Current annual maintenance cost (direct only)
Pull the actual budget line: infrastructure contracts, licensing, and specialist labor hours multiplied by the rate. This is your base. For most mid-market organizations, this number is $400,000-$800,000 for 10-15 applications in direct costs alone.
2. Indirect cost multiplier
Productivity loss and opportunity cost typically add 40-80% on top of direct costs, depending on how tightly the legacy system constrains your development velocity. If your engineers spend 30% of their time on maintenance tasks, calculate the fully-loaded annual cost of that time and add it.
3. Annual escalation rate
Use a conservative 10-15% annual cost escalation. This accounts for specialist talent rate inflation, increasing compliance surface area, and accumulating technical debt. Apply it as a compound rate, not a flat addition.
4. Modernization cost and timeline
Get a scoped estimate for incremental modernization of your highest-cost applications. The estimate should come with a phase-by-phase cost breakdown, not a single total, so you can see which phase delivers which reduction.
5. Cost-of-delay calculation
With inputs 1-4, calculate what your maintenance cost will be in year 1, year 3, and year 5 if you defer. Compare that curve against the annualized cost of the modernization program. The year at which the compounding maintenance cost exceeds the modernization cost is your break-even crossover, and it tells you how long you can afford to wait.
Presenting maintenance tax as a financial liability, not an IT expense
The internal presentation that gets budget approved is not a technical roadmap. It’s a balance-sheet argument: the organization carries an unfunded liability equal to the present value of the compounding maintenance tax over a five-year horizon.
Put three numbers on the board: the current annual maintenance cost, the year-3 maintenance cost at 12% annual compounding, and the cost of the first modernization phase. The gap between year-3 maintenance and the modernization cost is the financial case. The board doesn’t need to understand the technical architecture. They need to see that deferring the decision is not a neutral choice; it’s a choice to pay more, starting now.
Organizations that frame legacy costs this way (as a financial liability with a compounding rate, not as an IT line item) get modernization budgets approved faster. The decision stops being a technical argument that the CFO has to trust on faith. It becomes a financial model that the CFO can stress-test and own.
Nexa’s AI-augmented cost mapping process produces exactly this output: a financial cost model built before any code changes, so your CEO and CFO can see the ROI math before committing to a modernization program. The assessment itself is the first deliverable.
The Maintenance Tax Is a Choice You Keep Making
Every year you defer modernization is a decision, just not a conscious one. The maintenance budget increases automatically. The COBOL talent pool shrinks automatically. The compliance surface area grows automatically. None of these requires your approval. They just bill you.
The organizations that get out of the maintenance trap don’t do it by finding a better way to manage legacy systems. They do it by getting an honest cost map, identifying the 2-4 applications where the tax is most concentrated, and starting an incremental modernization program that shrinks the liability before it compounds further.
Nexa’s legacy cost assessment gives your CEO and CFO a financial model before any code changes, built using AI-augmented analysis that maps your legacy cost structure in days, not months. You get the ROI math first. The modernization program follows the math.
If your maintenance budget went up again this year, the question isn’t whether you have a problem. The question is which application you’re starting with.
Book a legacy cost assessment with Nexa Devs
FAQ
How much does it cost to maintain a legacy system?
Direct maintenance costs for 10-15 legacy applications at mid-market scale typically run $400,000-$800,000 annually. Add indirect costs (productivity loss, downtime, and opportunity cost) and the total often reaches $1.5M-$3.5M, varying by industry, application complexity, and specialist talent availability.
How do you reduce software maintenance costs?
The most effective approach is incremental modernization targeting your highest-cost applications first. A structured legacy cost assessment identifies which 2-4 applications account for 60-70% of your total maintenance budget. Addressing those first delivers the largest cost reduction per dollar of modernization investment, typically within a 90-day window.
What is the cost of technical debt?
Technical debt consequences cost US businesses an estimated $2.41 trillion annually, according to Accenture. At mid-market scale, the total cost runs $3-6 million per year for a 20-person engineering team. The cost compounds annually as debt accumulates and slows development velocity.
How much do COBOL programmers make in 2026?
COBOL specialists command a significant premium due to scarcity. Contractor rates are widely reported in the $180-$250 per hour range in 2026, up from approximately $120 per hour in 2022. The rate increase reflects a talent pool shrinking roughly 10% per year through retirement, with demand remaining steady from organizations unable to exit COBOL-dependent systems.
Are COBOL developers still in demand?
Yes. The Open Mainframe Project estimated 84,000 unfilled mainframe COBOL positions, with roughly 10% of the developer population retiring annually. Organizations depending on COBOL systems can’t easily replace this capability, which is why contractor rates continue to escalate as the talent pool shrinks.
When does modernization become cheaper than maintenance?
At a 12% annual maintenance cost escalation, a $900,000 system costs over $1.1 million in three years. For most mid-market organizations running 10-15 applications, the break-even crossover falls within a 2-4 year horizon. Both maintenance cost and modernization cost increase with each year of delay.