
Table of Contents
Legacy Modernization ROI: Real Numbers to Get Budget Approved
You already know the pitch. Legacy systems cost too much to maintain, slow your team down, and block you from doing anything interesting with AI. The problem isn’t the premise. The problem is that when you try to build a business case, the numbers you find online are all from $50M enterprise transformation programs with 18-month timelines and an army of consultants.
That’s not your situation. You’re running a company with 50 to 500 people. Your IT engagement is going to be $500K to $2M, not $10M. You need numbers that actually fit your context, and a framework your CFO will accept.
This post gives you both.
The Maintenance Tax: What Legacy Systems Are Actually Costing You Right Now
Before you can justify a modernization investment, you need to price the status quo. Most CEOs underestimate this number because the costs are distributed across budget lines rather than sitting in a single “legacy system” line item.
The 60-80% IT Budget Trap and What It Means in Dollar Terms
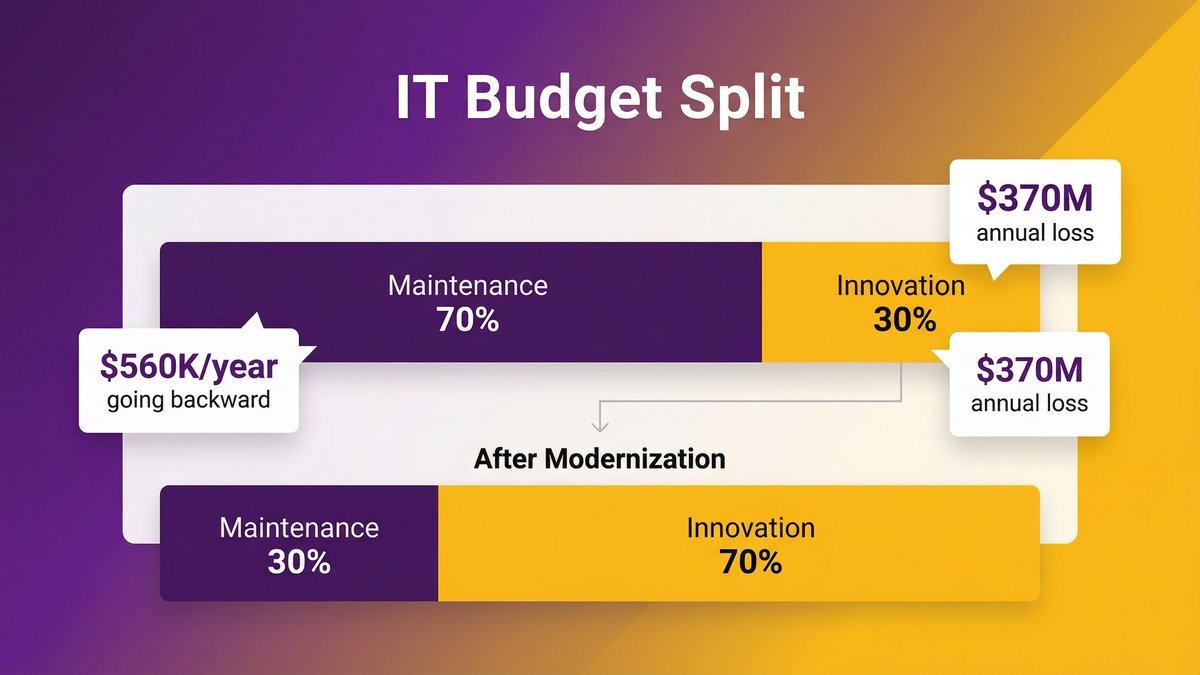
According to Quinnox (citing Gartner), 60-80% of IT budgets go to maintaining aging systems rather than building anything new. That number sounds abstract until you do the arithmetic for your own business.
Say your total IT spend — software licenses, internal IT staff, external contractors, cloud infrastructure — is $800K per year. At 70%, that’s $560K going backward. Not improving the system, not adding capability. Keeping it running. That $560K produces zero growth, zero competitive advantage, and zero AI readiness.
According to Deloitte’s 2026 Global Technology Leadership Study, technical debt accounts for 21% to 40% of an organization’s IT spending. Even at the low end, that’s real money that never converts into business outcomes.
The Hidden Costs That Don’t Show Up in Your IT Line Item
The direct maintenance number is only part of the picture. The rest shows up in places you’re not tracking:
- Delayed features. When your team spends 25-33% of developer time on technical debt, every new capability takes longer to ship than it should.
- Security exposure. According to Quinnox (citing the IBM 2023 Cost of a Data Breach Report), the average cost of a data breach is $4.45 million. Unmaintained legacy systems are the primary attack surface.
- Talent drag. Developers with current skills don’t want to work on COBOL or 15-year-old monoliths. You pay a premium to recruit engineers willing to take that work, and you lose the ones you have faster.
- Opportunity cost. Every sprint your team spends patching old code is a sprint not spent building the product capabilities that would grow your revenue.
According to Making Sense (2025), enterprises report losing approximately $370 million annually due to outdated technology and the burdens of technical debt. That figure skews large because it reflects enterprise-scale losses. At mid-market scale, the principle holds even if the number doesn’t: the cost of standing still is not zero.
What Modernization Actually Costs at Mid-Market Scale
Here’s where most ROI content fails the mid-market CEO. The case studies are all enterprise. IBM’s 74% cost reduction story comes from a Fortune 500 modernization with hundreds of systems and years of runway. That context doesn’t translate.
Let’s work with realistic numbers.
Phased vs. Full Rewrite: The Cost and Risk Difference
There are two fundamentally different approaches to modernization. Most conversations conflate them, which is why so many business cases fall apart.
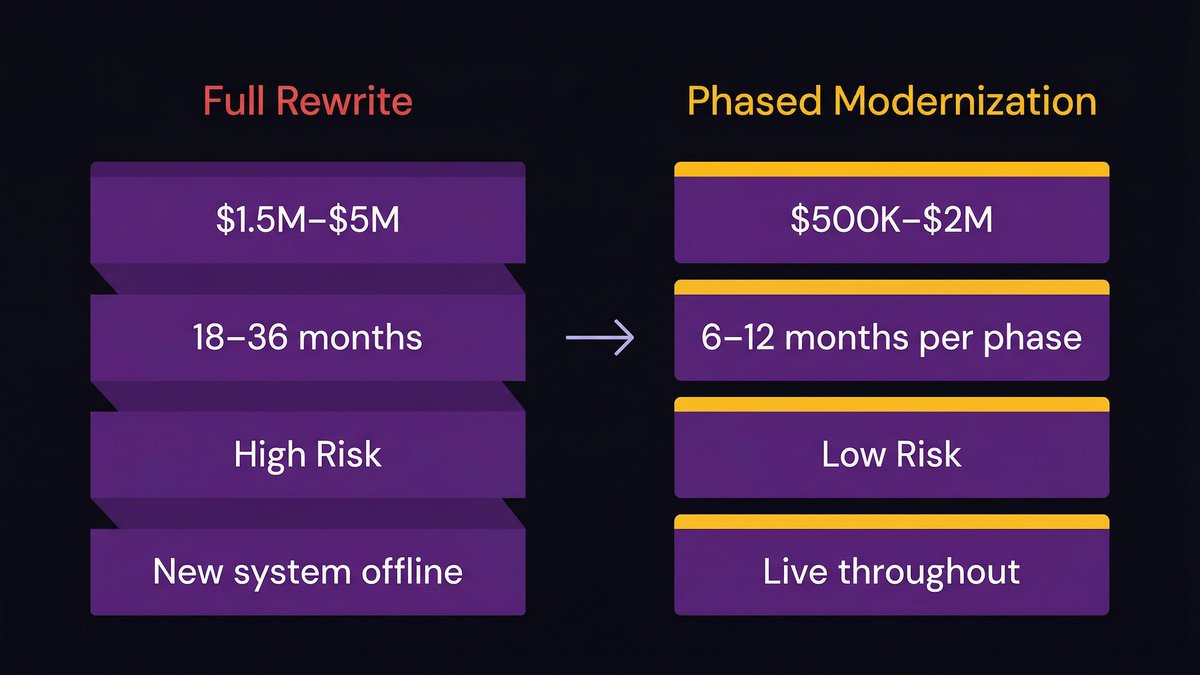
Full rewrite means rebuilding the system from scratch on a new stack while running the old one in parallel until the new system is ready to take over. At mid-market scale, this typically runs 18-36 months and costs $1.5M-$5M depending on system complexity. The risk is high. The payback window is long. And the business still depends on the old system the entire time.
Incremental (phased) modernization means decomposing the system into components and modernizing them one module at a time — the strangler fig pattern. You ship value faster, test in production, and the old system keeps running until each component is replaced. At mid-market scale, initial phases typically run $500K-$2M over 6-12 months with continued phases as budget and roadmap allow.
For most mid-market companies, the incremental path produces better ROI and lower risk. Full rewrites are appropriate for specific situations — systems that are completely unmaintainable, critical security failures, or architecture so degraded that phased improvement isn’t viable.
What a $500K-$2M Modernization Engagement Covers
At this scope, a well-structured modernization engagement typically includes:
- Architecture assessment of the existing system
- Migration of the highest-priority components (usually the ones generating the most maintenance cost or blocking the most growth)
- API layer development to connect the modernized components to the remaining legacy modules
- Cloud migration for modernized components
- Full documentation transfer: architecture diagrams, API references, system design docs
- One month of post-launch support with an ongoing SLA option
That’s not a complete system rebuild. It’s targeted, structured modernization designed to deliver measurable ROI within a 12-18 month window.
The Cost Variables That Determine Your Number
Four variables move your number the most:
- System complexity. How many integrations, how much undocumented logic, how many languages and frameworks?
- Scope of modernization. What percentage of the system are you migrating in this engagement?
- Target architecture. Cloud-native, containerized, or cloud-hosted — each has different cost and complexity profiles.
- Team model. Nearshore teams running in U.S. timezone alignment typically cost 40-60% less than equivalent onshore capacity, which directly extends what $1M of budget can deliver.
Contact Nexa Devs for a software architecture assessment
The ROI Numbers: What the Data Actually Shows
The ROI case for modernization is strong. The numbers below come from real modernization programs — mostly enterprise, some mid-market. Translate them to your context using the discount logic below.
Infrastructure and Maintenance Cost Reduction
According to UpdateCode (2026), IBM research shows legacy modernization delivers a 74% reduction in IT costs. AWS reports 66% infrastructure cost reduction post-modernization.
At mid-market scale, the infrastructure savings are real, but the percentage may be lower. A realistic expectation for a $1M scoped engagement is a 30-50% reduction in maintenance costs for the systems modernized. On $560K in annual maintenance spend, that’s $170K-$280K in annual savings.
That’s your payback math starting point.
Productivity and Time-to-Market Gains
According to Quinnox (citing McKinsey), organizations see 40% faster time-to-market, 30% reduction in operational costs, and double-digit revenue growth from modernization programs.
The time-to-market number tends to be the most powerful for mid-market CEOs, because it answers a question your board and investors care about: how fast can you ship? Legacy systems don’t just cost money to maintain. They create friction in every new development cycle. When a sprint that should take two weeks takes six because engineers are working around technical debt, every feature ships late.
According to Devox Software’s 2026 Legacy Modernization Report, AI applied to legacy modernization programs produces a 39% EBIT impact for high performers. That figure combines infrastructure savings, productivity gains, and new revenue from capabilities that were previously impossible to build.
Revenue Impact: The Cases Where Modernization Drove Growth
The revenue impact of modernization is the hardest to quantify in advance. But consider what becomes possible post-modernization that isn’t possible now:
- AI-powered features require clean, accessible data and modern APIs. Both are byproducts of modernization.
- Faster deployment cycles mean you can ship product improvements monthly rather than quarterly.
- System reliability improvements reduce customer churn in businesses where downtime has direct revenue consequences.
The businesses that see double-digit revenue growth from modernization aren’t the ones that treated it as a cost-reduction exercise. They’re the ones who modernized to build capabilities that weren’t previously available to them.
Read: “Technical debt cost.”
Payback Period: How Long Before Modernization Pays for Itself
Payback period is the CEO’s risk proxy. The shorter the window, the lower the exposure. This is the number that turns a theoretical ROI into a decision.
Incremental Modernization: 6-18 Month Payback Windows
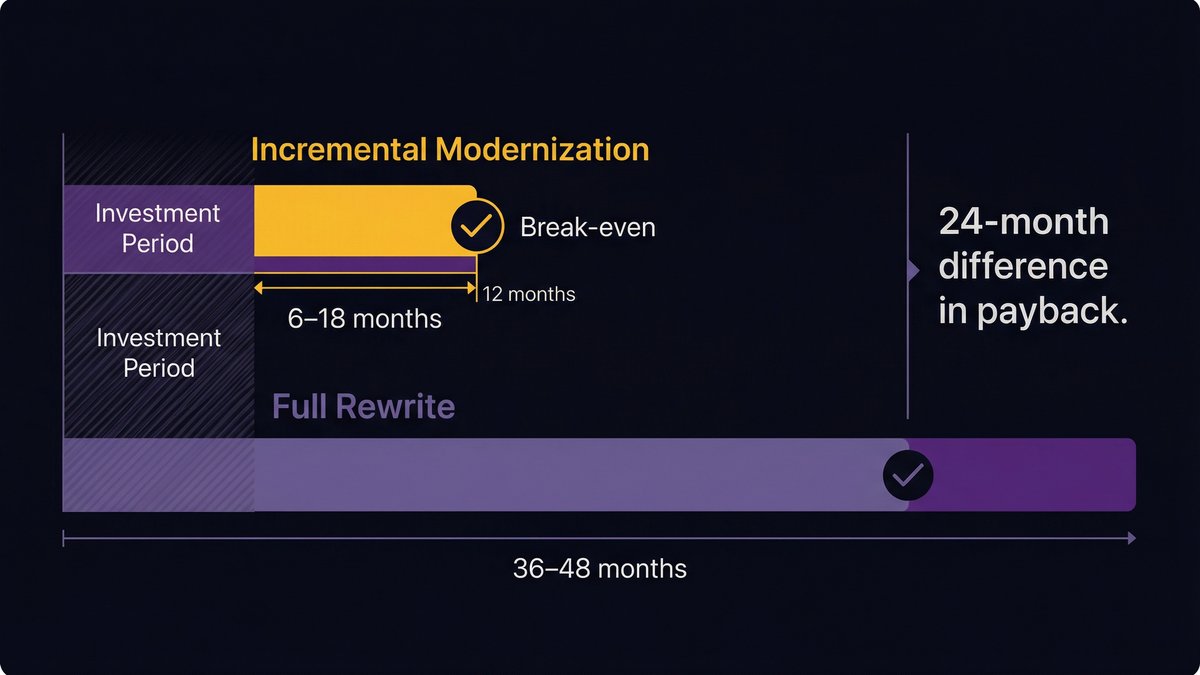
According to Bayone (2025), incremental modernization payback periods run 6-18 months, compared to 36-48 months for full rewrites.
That difference is significant. An 18-month payback on a $1M engagement means you’re break-even before the end of the second year. A 48-month payback on a $3M full rewrite means you’re four years out before the investment returns. Most mid-market companies can’t afford to wait that long, and most boards won’t approve it.
The 6-18 month window assumes you’re modernizing the highest-ROI components first, the ones generating the most maintenance cost or blocking the most revenue. That’s the sequencing decision that makes the payback window real rather than theoretical.
Full Rewrite Timelines: Why the Math Rarely Works for Mid-Market
Full rewrites at mid-market scale almost never produce the ROI they promise. The reasons are predictable:
- Scope creep extends timelines and costs
- The business doesn’t stop changing while the rewrite is underway
- Engineers spend more time learning the old system to replicate its behavior than building anything new
- The old system continues accumulating maintenance costs during the entire rewrite period
The exceptions are narrow: systems that are completely broken, security vulnerabilities so severe that continued operation is not viable, or architecture so degraded that incremental modernization would cost more than starting over. Outside those cases, phased modernization wins on both cost and risk.
How AI-Augmented Delivery Compresses the Payback Window
This is where delivery methodology becomes a strategic variable, not just a vendor selection detail.
AI-augmented development — using AI across the full software development lifecycle, from requirements analysis through implementation and testing — directly compresses the payback window in two ways.
First, faster delivery means less time before the modernized system starts generating savings. If an AI-augmented team delivers the first phase in four months instead of seven, you start recovering maintenance costs three months earlier.
Second, cleaner architecture on delivery means lower post-launch maintenance costs. Systems built with AI assistance tend to have more consistent code quality, higher test coverage, and better documentation than traditionally built systems, which reduces the ongoing cost basis from day one.
The combination doesn’t change the ROI math. It tightens the timeline on which you realize it.
The Cost of Waiting: What One More Year on Legacy Infrastructure Really Costs
Delay feels safe. It’s not. It’s an active choice with a compounding cost.
Compounding Maintenance Costs Year-Over-Year
Legacy systems don’t age gracefully. Every year of deferred modernization adds to the maintenance backlog, reduces the pool of engineers who can work on the system, and increases the cost of the eventual modernization. According to technical debt cost models, businesses lose 10-20% of their IT budget to technical debt every year without it appearing as a budget line item.
If you have $560K in annual maintenance spend today, waiting three years doesn’t save you $1.5M. It costs you that much, plus the maintenance costs keep accelerating as the system gets older and harder to work with.
Opportunity Costs: What You Can’t Build While Maintaining Legacy
The more consequential cost of waiting isn’t measured in IT budgets. It’s measured in what you can’t do.
As Ray Forte of Analog Devices described the problem: “low 80s” of the budget going to keep-the-lights-on operations means less than 20% available for anything new. That ratio doesn’t improve on its own.
More specifically: AI capabilities — the ones your competitors are building right now — require modern infrastructure. Clean data, accessible APIs, modular architecture. Every year you wait for modernization is another year your competitors are building AI-powered capabilities on top of their modernized systems while you’re still patching the old ones.
According to technical debt cost research (McKinsey, via Quinnox), technical debt will cost organizations $5 trillion in lost productivity by 2030. The individual company’s share of that number is the revenue they don’t generate because their engineering capacity is consumed by maintenance rather than growth.
Read: “legacy modernization approach.”
How to Build the Business Case Your CFO Will Actually Approve
The business case for modernization fails most often not because the numbers are wrong, but because they’re presented in terms a CFO doesn’t recognize.
CFOs don’t think in “modernization ROI.” They think in NPV, payback period, IRR, and risk-adjusted return. Give them those, and the conversation changes.
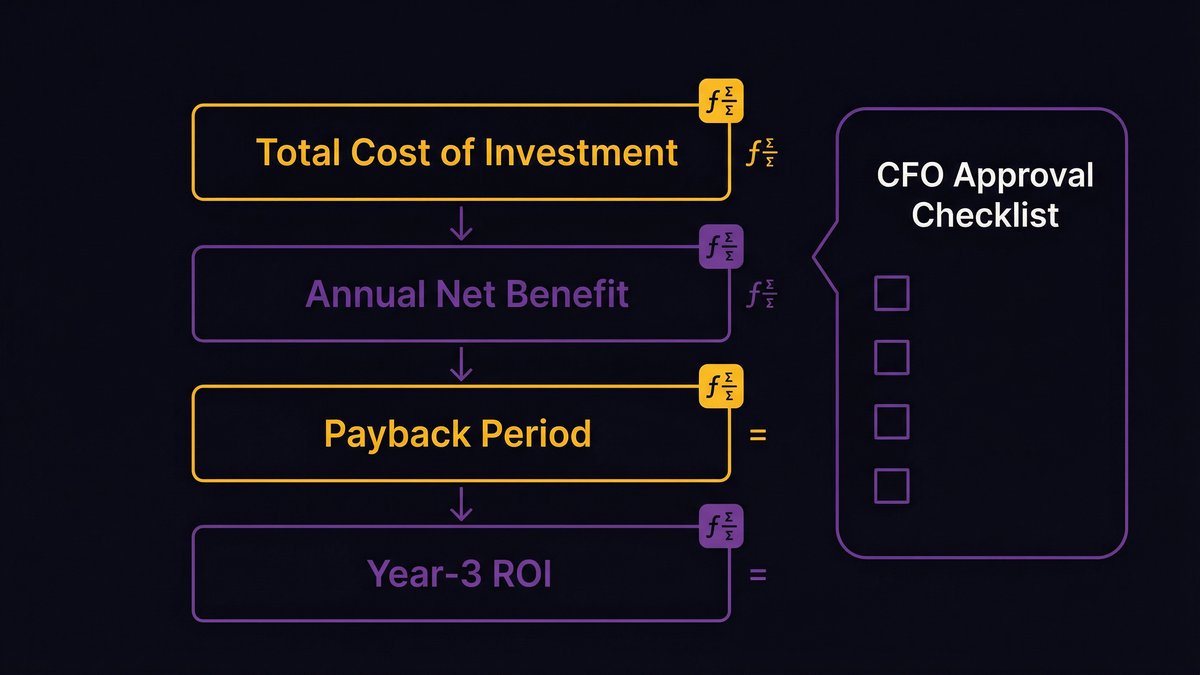
The Four Numbers Every CFO Wants to See
1. Total cost of investment (TCI). The full cost of the modernization engagement: vendor fees, internal staff time, downtime risk provisions, and change management. Not just the vendor quote.
2. Annual net benefit. What the modernized system saves annually compared to the current baseline: maintenance cost reduction, productivity gains (translated into labor costs), and any revenue upside. Be conservative. CFOs discount optimistic projections.
3. Payback period. TCI is divided by the annual net benefit. For a $1M engagement delivering $500K in annual savings, that’s a 24-month payback. For a $1M engagement delivering $700K in annual savings (factoring in productivity), that’s 17 months.
4. Year-3 ROI. Total net benefit over 36 months minus TCI, divided by TCI, expressed as a percentage. This is the number that makes the investment case obvious when it exceeds 100%.
Framing Modernization as Risk Reduction, Not Just Cost Savings
The strongest business cases for modernization combine cost savings with risk reduction. CFOs respond to risk reduction because it’s easier to model and harder to dispute.
The risk framing has two components:
- Security risk. Unpatched legacy systems are breach vectors. A single breach at $4.45M average cost (IBM, 2023) wipes out three to five years of the IT budget. Modernization is partial insurance against that exposure.
- Business continuity risk. If the one engineer who understands your legacy system leaves, how long before you can’t operate it? Key-person risk on legacy infrastructure is a material business continuity threat that most boards haven’t formally evaluated.
Read: “Institutional knowledge risk.”
A Simple ROI Model You Can Run Before Vendor Conversations
Before you talk to any vendor, run this four-step model:
Establish your current annual maintenance cost. Pull your IT budget. Estimate the percentage going to maintenance and keep-the-lights-on (60-80% is the typical range per Gartner). That’s your baseline waste.
Project annual benefit conservatively. Assume 30% maintenance cost reduction on the modernized scope (conservative vs. IBM’s 74%), plus 20% productivity gain on the engineering team time freed up. Translate that productivity gain into dollar value.
Get two vendor quotes for the incremental scope. Structure the RFP around the highest-ROI components first, not the entire system. You’re looking for a phase-one engagement, not a full rewrite.
Run the payback math. Quote divided by annual benefit. If it’s under 24 months, the investment case is strong. If it’s 36+ months, review whether the scope is right.
This takes an afternoon to run. It gives you a defensible number for the CFO conversation before you’ve spent a dollar on vendor evaluation.
Choosing a Modernization Partner Without Creating a New Dependency
The most common CEO objection to modernization isn’t cost. It’s this: “We’ll just end up dependent on whoever does it.”
That fear is legitimate. Most legacy systems got that way because the vendor who built them left no documentation and no knowledge transfer. You replaced one black box with another. The prospect of doing it again — this time with a newer technology stack — is a rational deterrent.
The answer isn’t to avoid vendors. It’s to evaluate them on the variables that determine whether you end up owning the system or renting it.
What Documented Handoff Actually Means (and Why Most Vendors Don’t Offer It)
“Documented handoff” is not the same as “we’ll write some notes at the end.” A genuine documented handoff includes, at a minimum:
- UML architecture diagrams covering the system as-built
- API documentation (Swagger or Postman format) covering all internal and external interfaces
- System design documents explaining key architectural decisions and why they were made
- User story libraries covering the full scope of implemented features
- Test coverage reports showing what’s tested and what isn’t
- Onboarding documentation sufficient for a new engineer to work productively on the system within two weeks
That set of deliverables transfers the system knowledge from the vendor to your organization unconditionally. It means the next engineer — whether from Nexa, another vendor, or your own team — can pick up the system without starting from scratch.
Most vendors don’t offer this because it requires investment in documentation throughout the engagement, not just at the end. It’s easier to skip it and rely on ongoing support relationships to maintain their position. That reliance is the dependency you’re trying to avoid.
Questions to Ask Any Vendor Before You Sign
Use these before you sign anything:
- What documentation will you transfer at project close, and can you show me examples from a prior engagement?
- Who owns the IP, and is that ownership unconditional or tied to ongoing payment?
- If we end the engagement at delivery, how long would it take a competent engineer unfamiliar with this system to become productive?
- Do you offer phased delivery with working software at each phase checkpoint — or does the first deliverable come at the end?
- Can we see code and documentation at any point during the engagement, not just at handoff?
Vendors who can’t answer questions 1 and 3 confidently are telling you something about what you’ll actually receive.
As Juris Bergmanis, Corporate Strategy & IT Project Manager, LTECH (2026) said, “A vendor can only be considered easy to replace if it can be done without rebuilding systems, transforming data, or interrupting business operations. If even one of these conditions is not met, the replacement cannot realistically be considered easy, regardless of what the contract states. This is not a legal question but a practical capability of the organization.”
The core risk isn’t the initial engagement — it’s what happens after the vendor leaves.
Get a Modernization ROI Estimate Before You Commit to Scope
Before you run the CFO conversation, you need numbers tied to your specific system — not industry averages. Nexa’s architecture assessment identifies which components of your system are generating the most maintenance cost, which are blocking AI capability, and what phased modernization would actually cost at your scale.
Book a modernization assessment
The assessment takes two to three weeks. You get a documented report covering current maintenance cost drivers, recommended modernization sequence and scope, and a phased ROI model you can take to your CFO.
FAQ
What is the ROI of legacy modernization?
Legacy modernization ROI varies by scope and approach. IBM data shows a 74% IT cost reduction; AWS reports 66% infrastructure cost savings. Forrester found 228% ROI over three years for Azure PaaS modernization. At mid-market scale, expect 30-50% maintenance cost reduction with full payback in 12-24 months on a phased engagement.
What is the cost of technical debt to a business?
According to Deloitte’s 2026 Global Technology Leadership Study, technical debt accounts for 21% to 40% of an organization’s IT spending. Enterprises lose approximately $370 million annually due to outdated technology (Making Sense, 2025). For mid-market companies, this means hundreds of thousands in annual maintenance spend that produces no growth or innovation.
What is a good payback period for an IT modernization investment?
According to Bayone (2025), incremental modernization delivers payback in 6-18 months, versus 36-48 months for full rewrites. For mid-market companies, any phased modernization engagement with a sub-24-month payback is a strong investment. A 36-month payback usually signals a wrong scope or a wrong approach.
What is technical debt in business terms?
Technical debt is the accumulated cost of past software shortcuts. Teams pay interest continuously through slower feature development, higher maintenance costs, and lower system reliability. According to Deloitte, this interest payment consumes 21-40% of a typical organization’s entire IT budget.
How much does a digital transformation or modernization project cost?
At mid-market scale (50-500 employees), a phased modernization engagement typically runs $500K-$2M for the first phase. Enterprise programs run $10M+, which is why most published ROI figures don’t apply to mid-market situations. Nearshore teams can reduce costs by 40-60% versus equivalent onshore capacity.
What percentage of IT budgets goes to maintaining legacy systems?
According to Gartner (via Quinnox), 60-80% of IT budgets go to maintaining aging systems. CIO Dive (2025) found 43% goes specifically to legacy maintenance, with only 29% allocated to transformative technology.