by Sarah Mitchell | Jul 16, 2026 | Custom Software Development
ERP Implementation Failure: Why Mid-Market Companies Keep Paying the Price
There’s a version of this story that plays out in boardrooms about twice a year. A CEO signs an ERP contract after a sixteen-week sales process. The implementation kicks off. Eighteen months later, the go-live date has slipped three times, the budget has doubled, and half the company’s operations are running on spreadsheets because the new system can’t handle the workflows everyone actually uses. The implementation partner says the scope changed. The vendor says the data migration was more complex than anticipated. The CFO is asking why a system that was supposed to reduce costs is now the single biggest line item in IT.
ERP implementation failure isn’t an anomaly. It’s a pattern. And for mid-market companies, those in the 50- to 500-employee range, the pattern is especially punishing because there’s no budget buffer and no enterprise-scale PMO to absorb the damage.
This post breaks down why it keeps happening, what the real failure mechanism is, and what mid-market CEOs and COOs can do instead.
Why ERP Fails at the Starting Line
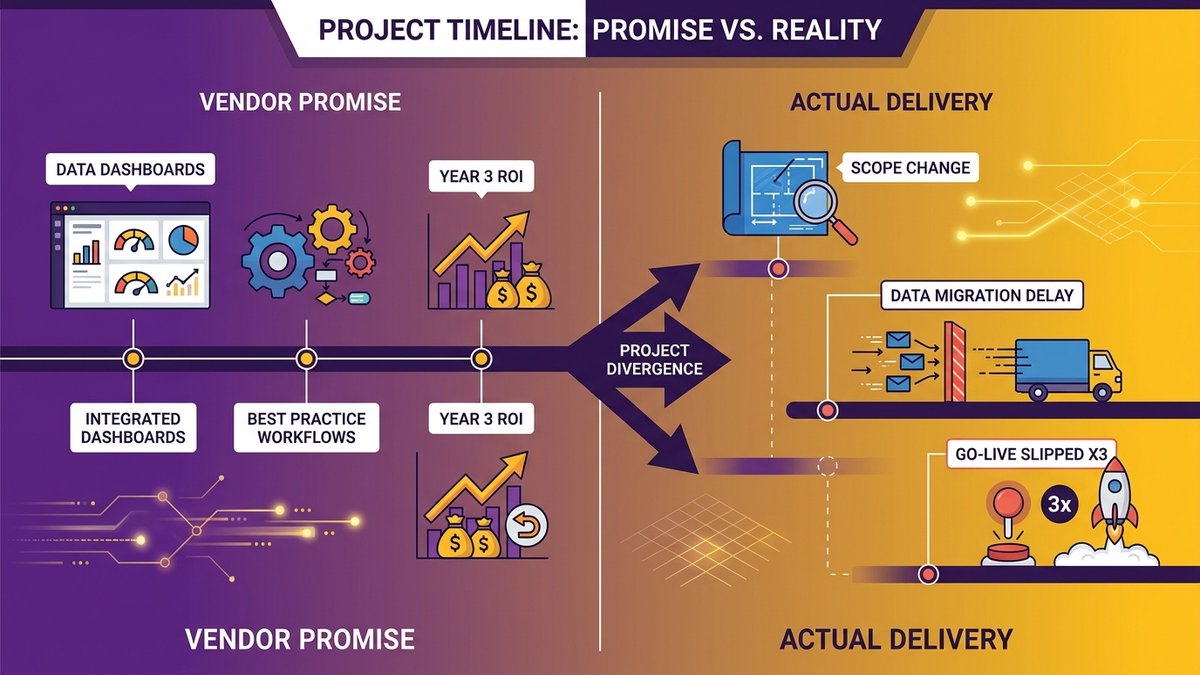
The pitch and the contract are fundamentally different documents. That gap is where most ERP implementations are already broken before they start.

A CEO reviews an ERP implementation timeline against actual project milestones: the gap between promise and delivery rarely stays hidden past go-live.
What the Vendor Deck Shows, and What the Contract Actually Commits To
The sales process for a mid-market ERP contract typically runs three to four months. You see demos of clean, integrated dashboards. The implementation partner talks about “best practice workflows” and “out-of-the-box configuration.” The total cost of ownership model looks favorable by year three.
What the contract actually commits to is narrower. It commits to delivering a configured version of software that operates according to the vendor’s workflow assumptions. When those assumptions don’t match how your business actually runs (and they rarely do, precisely), the contract gives you options like custom development (expensive), configuration workarounds (fragile), or process change (organizational pain). The vendor wins in all three scenarios.
None of this is concealed. It’s just rarely surfaced until you’re nine months in and the implementation partner is explaining that your five core operational processes need to be redesigned to match what the software expects.
The Gartner Number Every CEO Should Know Before Signing
Gartner projects that more than 70% of ERP implementations will fail to meet their original business case goals by 2027. That’s not a fringe finding from a boutique consultancy. It’s the most widely cited analyst assessment in enterprise software, and the 70% figure has been directionally consistent for over a decade, suggesting the problem is structural rather than a matter of companies making preventable mistakes.
Panorama Consulting Group’s methodology puts average cost overruns at 189% across all industries, with discrete manufacturing experiencing 215%. Only 32% of ERP projects achieve their stated objectives. The Hidden Tax of Technical Debt
Those numbers deserve a moment. If you went into any other capital expenditure category expecting an 189% cost overrun and a 68% failure rate, the board would reject the investment before you finished the sentence.
The Real Pattern: It’s the Architecture, Not the Team
ERP implementations fail because packaged software is architected to make the business adapt to it. That’s not a flaw in how implementations are managed. It’s how the product works.
Why ERP Vendors Win When You Change Your Workflows, Not When You Change the Software
An ERP vendor builds one system and sells it to thousands of companies. To make that math work economically, the system has to encode “best practice” workflows that approximate how most companies in a given sector operate. When your workflows diverge from those assumptions (and every company that has survived long enough to care about ERP has differentiated workflows, because differentiation is how companies survive), you have three options.
You can change how the software works. This is expensive and often contractually limited.
You can change how your business works. This is what implementation partners mean by “process harmonization”: a polished way of saying your people have to work differently to satisfy the software’s assumptions.
You can live with the workaround. Most implementations end up here: a system that theoretically runs certain processes, and a parallel layer of spreadsheets and manual steps handling the parts that don’t fit.
As one experienced ERP consultant described it in a public forum after roughly thirty client implementations: “No two businesses are exactly alike. Often not even close. The very act of survival requires many businesses to differentiate themselves to find a competitive edge. This differentiation is often in an area already standardized by their packaged software. So it doesn’t work. And can’t.”
That’s held true across thirty years of ERP projects. The software’s architecture isn’t the bug. It’s the feature, for the vendor.
The Fit Gap Illusion: How Gap Analyses Systematically Undercount Workflow Divergence
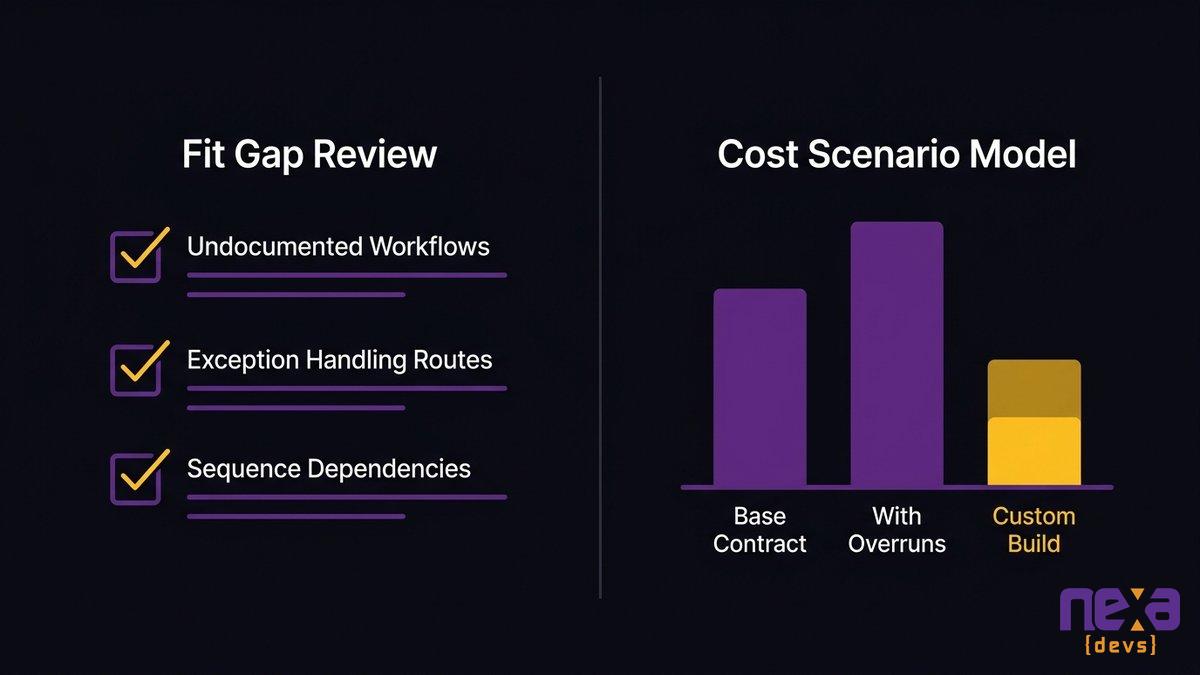
Before signing an ERP contract, most mid-market companies run a fit gap analysis: a structured assessment of how well the software’s built-in functionality matches current operational processes. The analysis typically shows a manageable gap. That’s usually a flawed measurement.
Fit gap analyses capture the workflows that are visible and documented. They don’t capture the institutional knowledge baked into how people actually do the work: the sequence of steps that experienced staff follow automatically, the exception-handling routines that aren’t in any process document, the data relationships that evolved organically and never got formally specified.
When those hidden workflows collide with the ERP’s assumptions at go-live, the implementation partner calls it “scope creep.” From where you’re standing, it looks like the system doesn’t work. Both descriptions are accurate. Neither is helpful at that point.
What $100M Failures Actually Look Like
These aren’t cautionary tales about companies that cut corners or skipped due diligence. They’re about companies that ran thorough implementation processes and still failed for structural reasons.
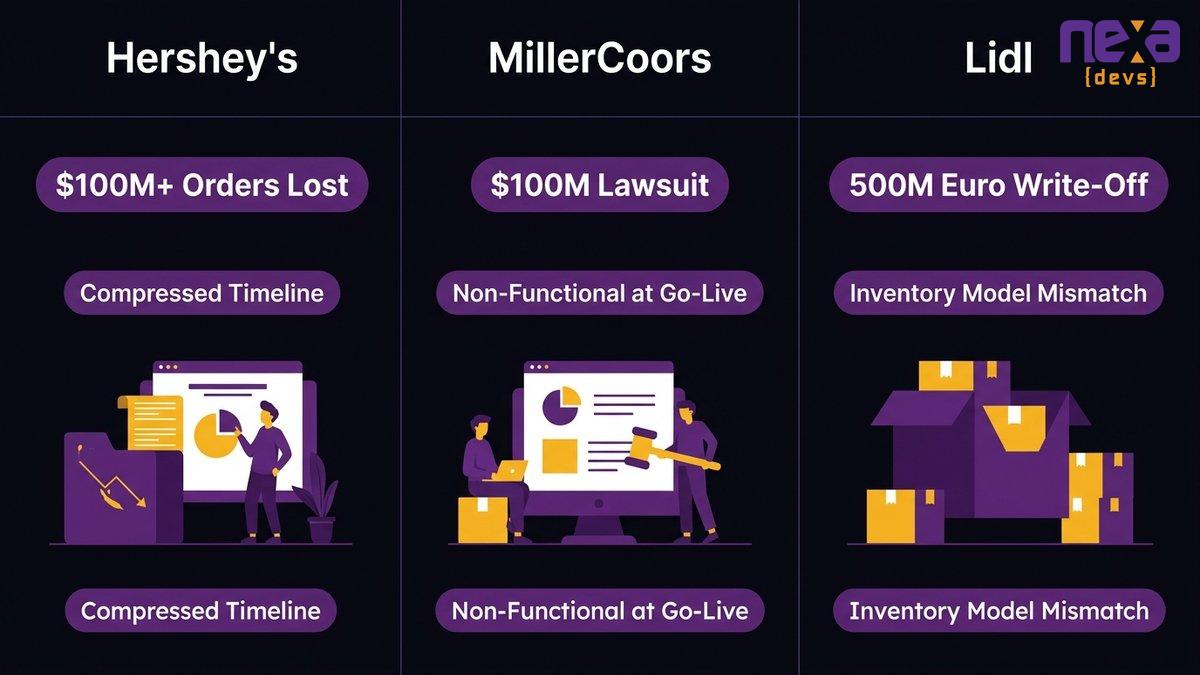
Famous ERP failures at Hershey, Lidl, and MillerCoors share a structural pattern: workflow reality diverged from packaged software assumptions at a moment the business couldn’t absorb.
Hershey’s: Compressed Timelines, Peak Season, $100M in Unprocessed Orders
In 1999, Hershey’s went live with a combined SAP, Manugistics, and Siebel implementation in the middle of the Halloween and Christmas shipping season. CIO.com’s reporting on company filings and historical analyses found the result was more than $100 million in unprocessed orders, a 19% quarterly profit decline, an 8% single-day stock drop, and a 12% annual revenue fall between 1998 and 1999.
The implementation was compressed from four years to thirty months under budget pressure. The seasonal timing was flagged internally and overruled. The system went live before testing was complete. Every warning sign was visible before go-live. None of them stopped the project.
MillerCoors: A $100M Lawsuit and a Project Dead Before Go-Live
MillerCoors filed a $100 million lawsuit following its ERP failure in 2017. CIO.com, citing court filings, reported the company’s complaint alleged that the implementation partner had failed to deliver a functional system despite years of work and payments. The project was, by the lawsuit’s account, non-functional at the time it was supposed to be live.
The suit named specific deliverables that were promised and never arrived. This wasn’t a case of a system that worked imperfectly. This was a system that didn’t work.
Lidl: 500M Euros Written Off After Seven Years, Then a Return to the Old System
In 2018, Lidl wrote off 500 million euros on a failed SAP implementation and reverted to its legacy system. CIO.com cited the company’s announcement directly. The project had run for seven years.
Lidl’s specific failure point was a mismatch between SAP’s inventory valuation method and Lidl’s existing approach. SAP uses retail price for inventory valuation; Lidl used purchase price. Changing the system would have required changing a core operational decision the company had made before the implementation began. Changing the company to fit the system was not viable after seven years of accumulated workflow dependencies.
Seven years. Half a billion euros. The old system.
The Mid-Market Version: Smaller Numbers, Same Structural Failure
Mid-market ERP failures don’t make CIO.com. They don’t generate $100M lawsuits or board-level write-offs that require a press release. They generate a company that spent $400,000 to $2 million on a system it partially uses, supplemented by the spreadsheets it was trying to replace, operated by people who are now deeply skeptical of any future system change.
The numbers are smaller. The failure mode is the same.
Why Mid-Market Is Uniquely Exposed
Large enterprises take real damage from ERP failures. Mid-market companies can’t weather the same hit. The structural reasons explain why.
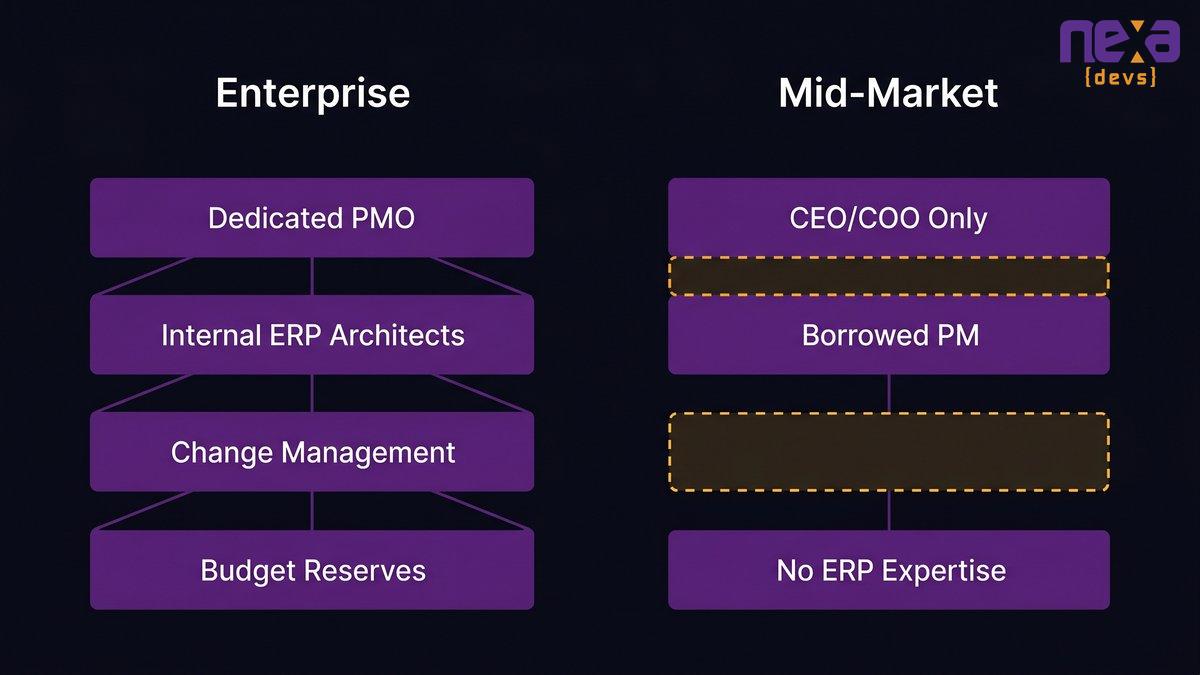
Mid-market operations lack the PMO infrastructure and internal ERP expertise that larger enterprises use to absorb implementation risk, making them structurally more vulnerable to cost overruns and scope failures.
No Dedicated PMO, No Internal ERP Expertise, No Buffer for 189% Cost Overruns
A Fortune 500 company implementing SAP has a dedicated project management office, internal systems architects who have been through prior implementations, a change management function, and budget reserves allocated for implementation contingency. When something goes wrong (and something always goes wrong), there are structures to absorb the impact.
A mid-market company at 200 employees has the CEO, the COO, one or two IT staff who have never managed an ERP implementation, and a project manager borrowed from operations who is also responsible for their actual job. When the implementation partner asks for a scope change decision, it comes to the CEO. When the data migration hits unexpected complexity, there’s no internal team qualified to evaluate the vendor’s proposed solution.
The 189% average cost overrun that Panorama Consulting documents is painful but survivable for a large enterprise. For a company with an annual IT budget of $2 million, a 189% overrun on a $500,000 implementation project is a board-level crisis.
The Consultant Dependency Trap: Mid-Market Companies Pay for Expertise They Can’t Retain
ERP implementations require specialized expertise that most mid-market companies don’t have in-house. So they rent it from implementation partners for the duration of the project. When that relationship ends, all the institutional knowledge about why things were configured the way they were, what the customizations actually do, and where the edge cases live goes with it.
What stays behind is a system the internal team runs but doesn’t fully understand. Maintenance goes back to the original partner at premium rates, or to a new one starting from scratch. The dependency doesn’t stop at go-live. It just changes shape.
This is the vendor dependency pattern that mid-market CEOs describe as feeling like a “hostage negotiation.” They signed a contract to solve an operational problem. They ended up in a long-term dependency on a vendor whose incentive structure doesn’t align with theirs.
The Sunk Cost Trap: Why Companies Keep Doubling Down
The most expensive phase of an ERP failure is the period after the warning signs are clear and before the decision to stop.
The Psychology of “We’ve Come Too Far to Stop Now”
At some point in a failing ERP implementation, usually somewhere between month eight and month eighteen, the internal signals become unambiguous. Timelines are slipping. Budget is gone. The system can’t do what was promised in the pre-sales process. The people who use it daily have developed workarounds that reproduce the spreadsheet problem the system was supposed to solve.
And yet the project continues.
This pattern shows up well outside ERP: organizations that have invested heavily in a course of action grow more committed to it as evidence mounts that it’s failing. Stopping means admitting the investment was wrong. Continuing means holding onto the possibility that the next phase will be different. Neither option is rational at that point, but one of them avoids the conversation with the board.
For a CEO or COO who championed the initiative, approved the vendor, and signed the contract, stopping is a public reckoning. Continuing costs more money but avoids that conversation. The math says stop. The organizational dynamics say keep going.
Recognizing the Decision Point: When to Cut Losses vs. When to Push Through
There’s a legitimate version of this question. Some ERP implementations recover. The ones that recover share certain characteristics: the core workflow gap has been identified and scoped, there’s a credible path to close it, the implementation partner has skin in the game for the outcome, and the organization has the internal capacity to drive the change management required.
The ones that don’t recover keep receiving remediation timelines that slip, scope additions that weren’t in the original contract, and explanations that locate the problem in the client’s processes rather than the vendor’s configuration.
The question to ask is not “how much have we spent?” That’s the sunk cost framing. The question is: “Given what we know now about the gap between this system’s capabilities and our actual operational requirements, what is the realistic path to closing that gap, and what does it cost compared to starting with a system built for our requirements?” Technical Debt ROI Framework
What Actually Fixes This: Systems Built Around Your Workflows
The alternative to ERP failure isn’t a better ERP implementation. For a significant portion of mid-market companies, the right answer is a system designed from scratch around how the business actually works.
Custom-Designed Workflow Systems vs. Packaged ERP: The Strategic Trade-Off
Packaged ERP gives you proven functionality across a wide range of processes, fast time to value for the processes that fit, and a vendor roadmap that evolves the product without requiring your internal investment. The trade-off is that you adapt to the software: your workflows, your exceptions, your competitive differentiators all get filtered through what the package allows.
Custom-built systems give you software that fits the actual workflow, no forced process harmonization, and no dependency on a vendor’s architecture decisions. The trade-off is a higher upfront cost and the requirement to own the system long-term.
For companies whose competitive advantage lives in the processes that ERP doesn’t fit, and that describes most mid-market companies that have survived long enough to be having this conversation, the trade-off favors building.
The position here is clear: for mid-market companies with differentiated workflows that a packaged system can’t accommodate without significant customization, custom-built software is the more rational choice. Not always. But for more companies than currently believe it.
The Build Cost Myth: Why Custom Isn’t Always More Expensive Over Five Years
The comparison most companies make is wrong. They compare the sticker price of an ERP license plus implementation against a software build estimate. The correct comparison includes the full five-year cost of ERP ownership: annual license fees, implementation partner support, customization work, upgrade cycles, data migration when the vendor moves to a new platform, and the productivity loss embedded in workflows the software never quite supported.
Panorama Consulting’s methodology finds that 50% of ERP projects require additional unplanned technology, and 40% underestimate staffing requirements. Those aren’t implementation costs. They’re ongoing operational costs that don’t appear in the original TCO model.
When you add those to the comparison, the build option is often cost-competitive within a five-year horizon, especially at mid-market scale where the license plus implementation costs are comparable to a custom build that produces a system you own outright.
What Nearshore AI-Augmented Development Makes Possible
Three years ago, the build argument was harder to make for mid-market companies because the cost and timeline of custom development were harder to predict and control. AI-augmented development has changed both variables.
Nearshore teams running AI across the full build cycle, from requirements and architecture through implementation and testing, are delivering systems faster and with better documentation than comparable projects looked like two or three years ago. The documentation piece matters specifically here: one persistent failure mode of custom-built systems is that they become the next black box nobody understands. When documentation is generated as a standard output of the development process rather than a checklist item tacked on at the end, that changes.
At Nexa Devs, every system delivered comes with complete documentation transferred unconditionally to the client. UML architecture diagrams, system design documents, API references, test coverage reports: all of it owned by the client from day one, regardless of whether the engagement continues. The goal is to eliminate the new-vendor-dependency problem entirely, not just shift it.
Before You Sign the Next Contract: Six Questions Every CEO Should Ask
If you’re evaluating a new ERP or reassessing a current one, these questions create a clearer picture of what you’re actually buying.
An executive review of ERP vendor proposals should include workflow fit documentation and cost-overrun scenario modeling, not just feature comparison.
Questions About Fit Gap Methodology and Workflow Preservation
Question 1: How does your fit gap analysis account for undocumented workflows?
The vendor will describe a structured documentation process. Ask specifically how they handle the processes that experienced staff perform from memory: the exception-handling routines, the sequence dependencies that aren’t in any written process map. If the answer is “we’ll document them during discovery,” ask what happens when discovery misses something and it surfaces at go-live. What does that cost, who pays for it, and how long does it take?
Question 2: For the workflows where there’s a gap between what your system does and what we currently do, what are the options, and who bears the cost of each?
Get this in writing. “Best practice alignment” usually means “you’ll change your workflow.” That’s not inherently wrong, but it should be an explicit decision with a documented cost, not something that surfaces in month nine as a scope change.
Questions About Cost-Overrun Scenarios and Contractual Protections
Question 3: What percentage of your implementations at our scale come in on time and on budget?
If the answer isn’t immediately available, or if it’s presented as a success rate rather than an on-time/on-budget rate, push for specifics. An implementation that went live twelve months late but is now “successful” from the vendor’s perspective isn’t the same as one that hit its original timeline.
Question 4: What protections does the contract include if the system doesn’t perform as demonstrated in the pre-sales process?
Ask specifically what happens if core workflows demonstrated in the demo turn out to require customization to function in your environment. The answer tells you whether the vendor is confident in what they sold you or relying on contract language to manage the gap.
Questions About the Alternative to Packaged Software
Question 5: Have you modeled what it would cost to build a custom system for the five processes this ERP is meant to solve?
Most mid-market companies haven’t run this comparison before signing an ERP contract. They’ve compared ERP vendors. The build option is often dismissed as too expensive or too risky without a current estimate. Get the estimate. The gap between an ERP total cost of ownership and a custom build may be smaller than you expect.
Question 6: If this implementation doesn’t achieve its objectives, what are the exit options, and what does each cost?
This question makes vendors uncomfortable. It should. Companies that go into an ERP implementation without a clear understanding of the exit path end up in the sunk cost trap by default. Knowing the exit cost before signing changes the decision calculus, and changes what you’re willing to accept in the contract.
One Question Worth Sitting With
The companies that got burned by Hershey’s-scale ERP failures didn’t make stupid decisions. They made reasonable decisions with incomplete information, in organizations where stopping mid-implementation carried its own political cost.
Mid-market CEOs and COOs evaluating their current or future ERP situation deserve a clearer frame: the question isn’t whether your ERP implementation will be difficult. It’s whether the difficulty is worth what you get on the other side, and whether a system designed from the ground up around your actual workflows would get you there faster, cheaper, and with an outcome you own.
If you want to model what a custom-built alternative would cost for your specific operational scope, we’re happy to run that comparison before you sign anything. Talk to a development partner who will show you both options. Schedule a consultation
FAQ
What are the common ERP implementation failures?
The most common ERP implementation failures stem from workflow mismatches, compressed timelines, inadequate testing, and poor change management. Gartner’s data shows over 70% fail to meet original goals. The root cause: packaged software requires businesses to adapt workflows to the software rather than the other way around.
What is the fail rate of ERP implementation?
Gartner projects more than 70% of ERP implementations will fail to meet their original business case goals by 2027. Panorama Consulting puts the figure at 68% not achieving objectives. Only about 32% of ERP projects are considered fully successful by their original business case criteria.
How many SAP projects fail?
SAP implementations follow roughly the same pattern as ERP broadly. Lidl’s half-billion-euro write-off and MillerCoors’ $100M lawsuit were both SAP-related projects. The failure rate is not uniquely worse for SAP. The structural cause applies across vendors because it’s rooted in packaged-software architecture, not any specific product.
What are the common reasons for ERP implementation failure?
Core reasons include: fit gap analyses that underestimate workflow divergence, compressed timelines that skip adequate testing, insufficient change management, implementation partner misalignment, and the structural mismatch between packaged-software assumptions and differentiated business workflows. Mid-market companies face additional risk from lack of internal ERP expertise or dedicated PMO.
What is the difference between custom development and ERP?
ERP is packaged software built for broad applicability; your business adapts to its workflow assumptions. Custom development produces software designed around your specific workflows, owned outright. For companies with differentiated workflows that ERP can’t accommodate, custom development is often more cost-effective over a five-year horizon.
What is the Big 3 ERP system?
The Big 3 ERP systems are SAP, Oracle, and Microsoft Dynamics. All three follow the same packaged-software architecture prone to implementation failures. The fit-gap challenge, process harmonization requirement, and consultant dependency trap apply across all three platforms.
by Sarah Mitchell | Jul 14, 2026 | Outsourcing Software Development
Vendor Handoff Checklist for Software Development
The call happens on a Tuesday. Your project manager tries to reach the dev shop. The number rings out. You check your email: nothing in three weeks. Then someone finds their LinkedIn: the agency closed six weeks ago. The team scattered. The Slack workspace is gone. And the system your operations run on is now a black box with no key.
This isn’t an edge case. The ISG Index’s 2026 technology services analysis put the combined global market for technology services at a record $127.4 billion, a market that includes thousands of small and mid-size dev shops operating without succession plans, documentation standards, or any formal obligation to hand over what they built. When those shops close, change leadership, or hit a pricing dispute with a client, the code stays. The context doesn’t.
This guide covers what to do if you’re already in that situation, what a complete software handover checklist looks like, and how to write contracts that make vendor disappearance structurally impossible to sustain.
When the Vendor Goes Dark: How Mid-Market Companies End Up Trapped in Unmaintainable Systems
Your vendor didn’t set out to leave you stranded. The more common reality is that they simply didn’t build any obligation to stay coherent.
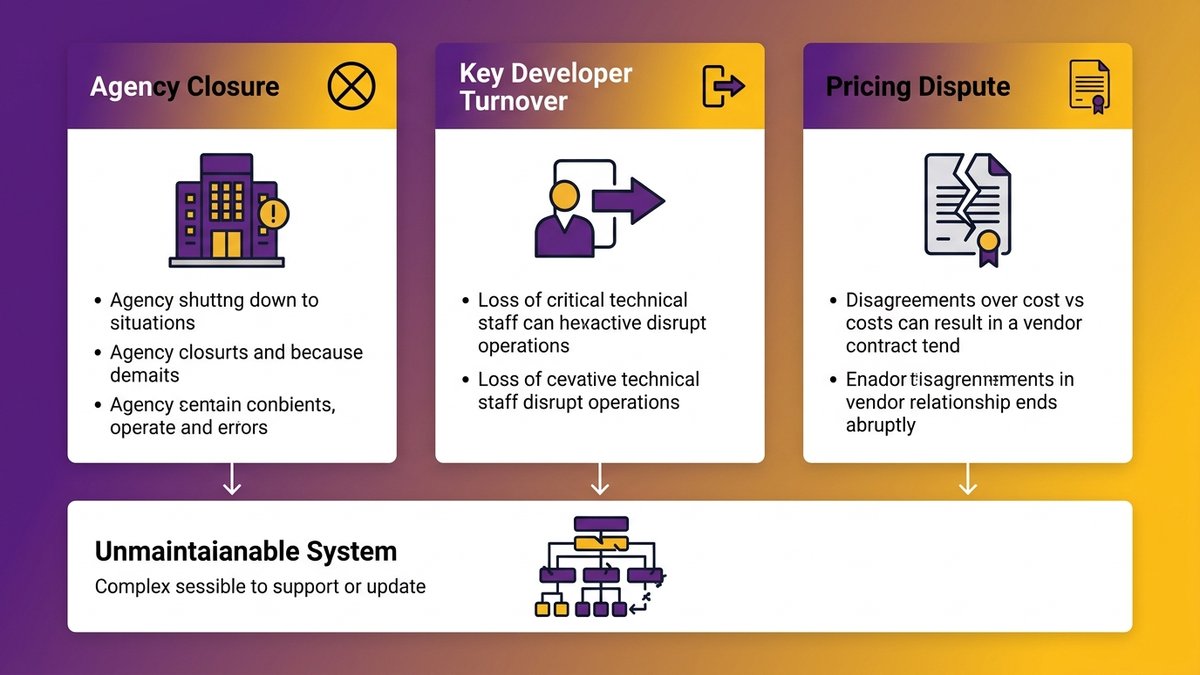
The three most common vendor disappearance scenarios that leave mid-market companies with unmaintainable systems.
The Three Scenarios That Trigger a Vendor Disappearance
The agency shutdown is the most dramatic version, but it’s not the most common. Three patterns account for most mid-market vendor handoff failures:
Agency closure or acquisition. Small development shops get acquired, pivot their business model, or simply dissolve. The founding developers move on. Whoever absorbed the assets doesn’t have your codebase. The documentation that never existed can’t be inherited.
Leadership or key developer turnover. The one person who understood your system took a new role. They’re contractually prohibited from sharing what they built. Their replacement has a full queue. The institutional knowledge that should have been in documentation existed only in one person’s head. That person is now at a competing firm.
Pricing dispute or contract non-renewal. The relationship ends acrimoniously. You stop paying, they stop responding. You own the IP in theory; in practice, you have production credentials that expired and a codebase that nobody at your company can navigate.
All three scenarios have the same outcome: a system your business depends on that you can’t maintain, can’t modify, and can’t hand to a new team without a significant reverse-engineering effort.
What “No Documentation” Actually Means for Your Business
“No documentation” sounds like an inconvenience. In practice, it means your next developer will spend their first 90 days figuring out what the system does rather than improving it. It means a bug that would take two hours to fix with architectural context takes two weeks without it. It means you can’t change an API integration, add a feature, or safely deploy an update until someone rebuilds the mental model of a system they didn’t build.
Dreamix’s research on vendor transitions puts it concisely: “Documentation gaps, undocumented dependencies, and lost configuration details create expensive problems months after transition completion.” Those problems don’t get cheaper the longer they sit.
The immediate operational impact depends on what the system does. A customer-facing billing platform with no handover documentation is a crisis. An internal reporting tool that nobody touches is a slow problem. Before you panic or minimize, you need to know what you actually have.
Outsourcing documentation as a vendor selection criterion
The Documentation Debt You Didn’t Know You Were Accumulating
Most vendor relationships don’t start with deception. They start with urgency.
What Vendors Leave Out, and Why
Development teams, especially smaller shops, optimize for shipping. Documentation doesn’t get reviewed at sprint demos. It doesn’t generate client applause. It doesn’t appear on the invoice in a line item that the client can scrutinize. So it gets deferred, abbreviated, or skipped entirely under schedule pressure, and both parties let it happen because neither the client nor the vendor made it contractually unavoidable.
The result is a structural incentive misalignment: the vendor gets paid when the feature ships, not when the handover packet is complete. The client sees a working product and assumes completeness. Six months later, when a developer needs to change something, the missing documentation becomes visible. And expensive.
This isn’t vendor malice. It’s a predictable consequence of contracts that measure delivery in features, not transferability.
The Difference Between Delivered Code and Transferable Code
Delivered code passes acceptance testing. Transferable code can be maintained, extended, and operated by someone who wasn’t part of building it.
A system can be fully functional and completely non-transferable at the same time. Non-transferable code has several recognizable characteristics:
- No README explaining the architecture or setup process
- Dependencies not explicitly tracked (no package lock file, no version pins)
- Environment variables and configuration values undocumented or committed directly to the repo
- No explanation of business logic in comments or architecture decision records
- Third-party credentials are stored in the developer’s personal accounts, not the client’s
- Deployment processes that exist only as undocumented tribal knowledge
You can ship working software with all of these conditions in place. What you can’t do is hand it to someone new and expect them to operate it confidently.
What You’re Actually Dealing With: The Post-Disappearance Code Audit
Your vendor is gone. You have a system. Now what?
The worst response is to immediately start hiring. The second-worst is to start rebuilding from scratch. Both decisions require information you don’t have yet.
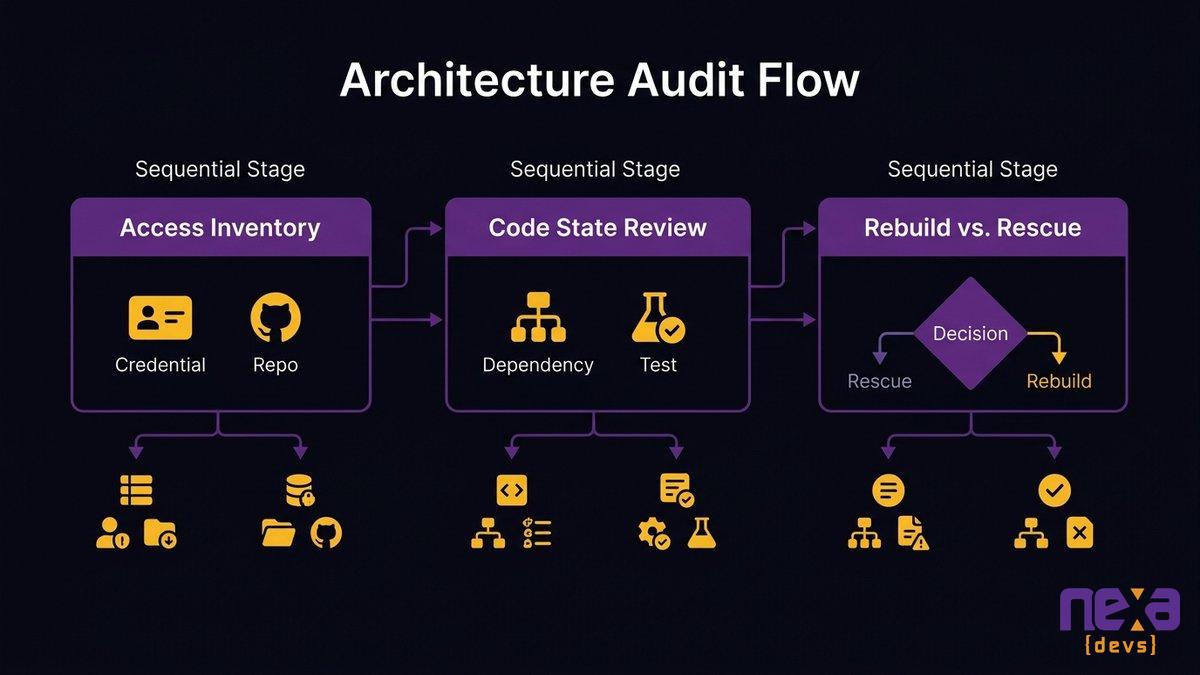
A structured triage approach to post-disappearance code audits, showing three stages: inventory, dependency mapping, and rebuild-vs-rescue assessment.
Triage Checklist: What Exists, What’s Missing, What’s Unusable
Before any cost estimates or recovery decisions, spend two to three days doing a systematic inventory. Work through this list:
Access and credentials
– Do you have the source code repository? Can you clone it?
– Do you have admin access to the production environment (hosting, cloud accounts)?
– Do you have the domain registrar login?
– Do you have database credentials or access to retrieve them?
– Do you have accounts for third-party services the system depends on (payment processors, email providers, analytics)?
Code state
– Is there a README? Does it accurately describe how to set up and run the system?
– Are dependencies tracked in a package manifest with version numbers?
– Can you spin up a local development environment in under an hour with what exists?
– Are there automated tests? Do they pass?
Architecture knowledge
– Is there any system architecture documentation, even a diagram?
– Are environment configuration requirements documented?
– Is the deployment process written down anywhere?
– Are there any architecture decision records explaining why key technical choices were made?
Business logic
– Is the core business logic readable without domain context?
– Are there comments explaining non-obvious decisions?
– Do variable and function names reflect the business domain, or are they opaque abbreviations?
Each “no” is a documentation gap. Rank them by operational risk: missing production credentials is a crisis. Missing architecture diagrams is a problem. Missing comments on a utility function is background noise.
Rebuild vs. Rescue: The Decision Framework for CEOs and CTOs
The rebuild-vs-rescue decision has a reputation for being a technical call. It isn’t. The technical input is only one factor.
Four questions determine the right answer:
1. Can a competent developer understand what the system does in two days of reading the code?
If yes, rescue is viable. If two days of reading leave a senior developer more confused, the comprehension problem will compound every hour of recovery work you do.
2. What is the business cost of extended downtime or feature freeze?
A rescue takes weeks to months. A rebuild takes months to a year or more. During that time, your ability to change the system is limited. If the system touches revenue, customer service, or regulatory compliance, the cost of that freeze factors directly into the rebuild threshold.
3. What does the system do that isn’t visible in the code?
Business rules, edge cases, and workflow exceptions built on domain knowledge your team holds (not the vendor’s) are rescuable. Business rules that only the vendor understood, with nothing visible in the code or documentation, are effectively lost regardless of which path you take.
4. What is the real cost of each option?
Which brings us to the next section.
Estimating Real Recovery Cost Before You Hire Anyone New
The most common mistake at this stage is asking a developer to estimate recovery cost before they’ve read the code. You’ll get a wide range that isn’t actionable.
A better sequence:
Engage a technical consultant or senior developer for a fixed-scope, time-boxed code audit: two to three days at a known rate. The deliverable is a written assessment: codebase comprehensibility score, dependency inventory, critical gap list, and a rough effort estimate for rescue vs. rebuild with confidence intervals.
That audit costs a few thousand dollars. It prevents a six-figure decision based on guesswork.
The Complete Software Handover Checklist: What Should Have Been Delivered
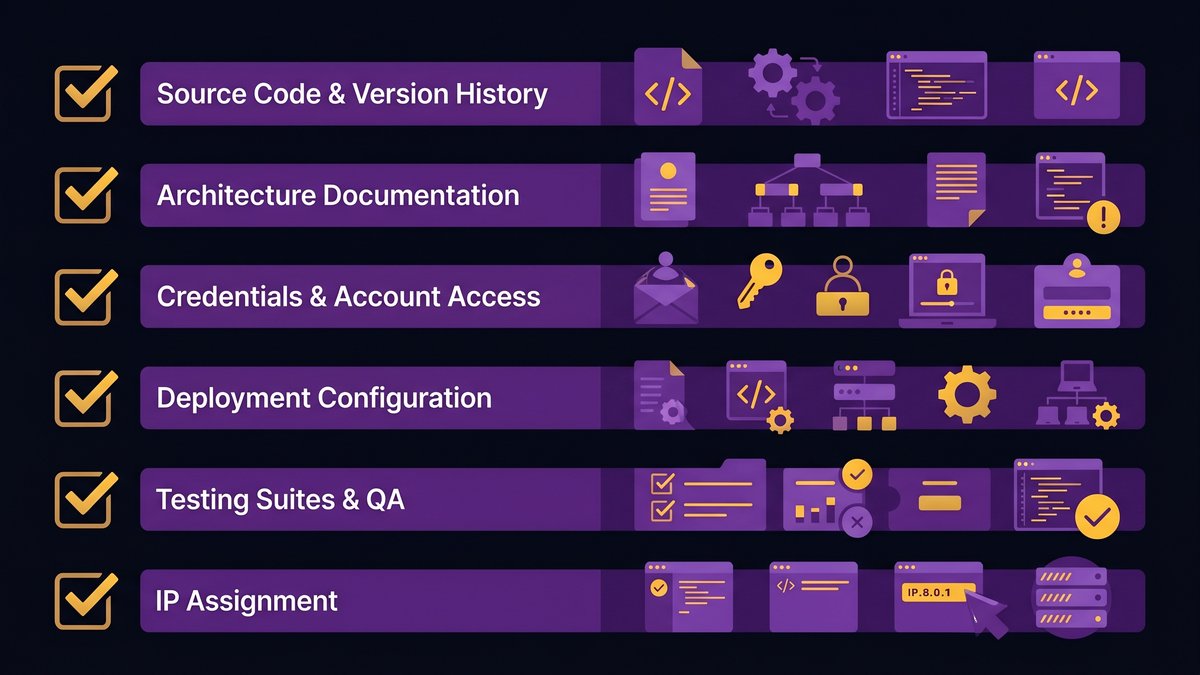
This is what a complete handover looks like. If you’re reading this before a project closes, make these requirements contractual. If you’re inheriting an undocumented system, use this as your recovery target list.
Complete vendor handoff checklist covering all six categories: source code, architecture documentation, credentials, deployment, testing, and IP transfer.
Source Code, Repositories, and Version History
- Full repository access with complete commit history (not just a ZIP of the current state)
- All branches, including development and staging branches
- Git tags for all production releases
- Documented branching strategy (how is main/master protected? how are releases tagged?)
- Submodules or external dependencies are explicitly identified
The commit history is not optional. It’s where the reasoning behind decisions lives. A ZIP of current code tells you what; the commit history tells you why.
Architecture and System Design Documentation
- High-level architecture diagram (what are the components, how do they communicate?)
- Data model documentation (schema, relationships, field-level explanations for non-obvious fields)
- API reference documentation (endpoints, request/response formats, authentication)
- Architecture decision records for significant technical choices
- Known limitations, performance ceilings, and scaling constraints
- Third-party integration documentation (which external services does this connect to, and how?)
Credentials, Accounts, and Third-Party Service Access
- Transfer of all production service accounts to client-owned email addresses
- Database credentials with rotation instructions
- SSL certificate details and renewal schedule
- API keys for all third-party services, with documentation of what each is used for
- Access to monitoring or error-tracking tools (Sentry, Datadog, etc.)
- DNS configuration documentation
One of the most common post-handover crises is discovering that the vendor’s personal Gmail account was the recovery email for production services. Confirm account ownership before the relationship ends.
Deployment, Infrastructure, and Environment Configuration
- Documented deployment process, step by step
- Environment variable reference (what variables does the system need, what are they for?)
- Infrastructure-as-code files if applicable (Terraform, CloudFormation, etc.)
- Staging and development environment setup documentation
- Database migration process and rollback procedure
- Monitoring and alerting configuration
Testing Suites and QA Documentation
- All automated test files (unit, integration, end-to-end)
- Instructions for running the test suite
- Current test coverage metrics
- Known failing tests with explanations
- Manual QA checklist for pre-release verification
- Load and performance test baselines if applicable
IP Assignment and Contract Clauses
- Signed IP assignment agreement confirming all code, documentation, and design assets transfer to the client
- Work-for-hire clause or equivalent in the original contract
- Confirmation that no open-source code was embedded under a license that restricts commercial use
- License documentation for all third-party components
How institutional knowledge disappears when vendors exit
Preventing the Next Disappearance: Contract Clauses That Force Documentation Transfer
The most effective vendor accountability tool isn’t a better evaluation process. It’s better contracts.
Milestone-Linked Documentation Requirements
Most contracts require documentation at project end. Change that to milestone-linked documentation throughout the engagement.
Practically, this means: at the close of each sprint or delivery phase, the vendor provides an updated documentation package covering what was built, what changed in the architecture, and any new dependencies or third-party integrations introduced. The client reviews and accepts this package as part of the milestone sign-off. Payment does not release without documentation acceptance.
Two effects follow from this structure. First, documentation stays current because it’s written close to the work, not six months after the fact. Second, it surfaces documentation gaps early, when they’re cheap to fix, rather than at project close, when the vendor is moving on.
IP Transfer Language That Actually Holds
Standard IP ownership clauses transfer legal title. They don’t transfer operational control. You can own the code and still be unable to run it without the vendor.
Stronger IP language includes:
- Explicit transfer of all accounts, credentials, and access required to operate the system
- A requirement that no production resources are registered in the vendor’s personal accounts
- A provision that the client receives admin access to all production environments at the start of the engagement, not at the end
- Clarification that the IP transfer covers all documentation, design files, test scripts, and deployment configuration, not only source code
The line worth borrowing from Pragmatic Coders’ research on vendor lock-in: “Legal IP ownership is not the same as practical operational control.” Write contracts that close the gap between the two.
Escrow and Code Repository Access Provisions
For long-running engagements or high-dependency systems, add a code escrow provision: a neutral third party holds a current copy of the repository, updated on a regular cadence, accessible to the client if the vendor fails to perform, ceases operations, or fails to respond within a defined window.
Less formally, the client can require repository access from day one. The vendor works in a client-owned repository (not their own), which means the client always has the current codebase regardless of what happens to the relationship. This costs nothing to implement and eliminates the most common handover failure mode entirely.
Why Vendor Accountability Starts Before You Sign the Contract
Documentation standards are hard to enforce retroactively. The evaluation phase is where you set the conditions.
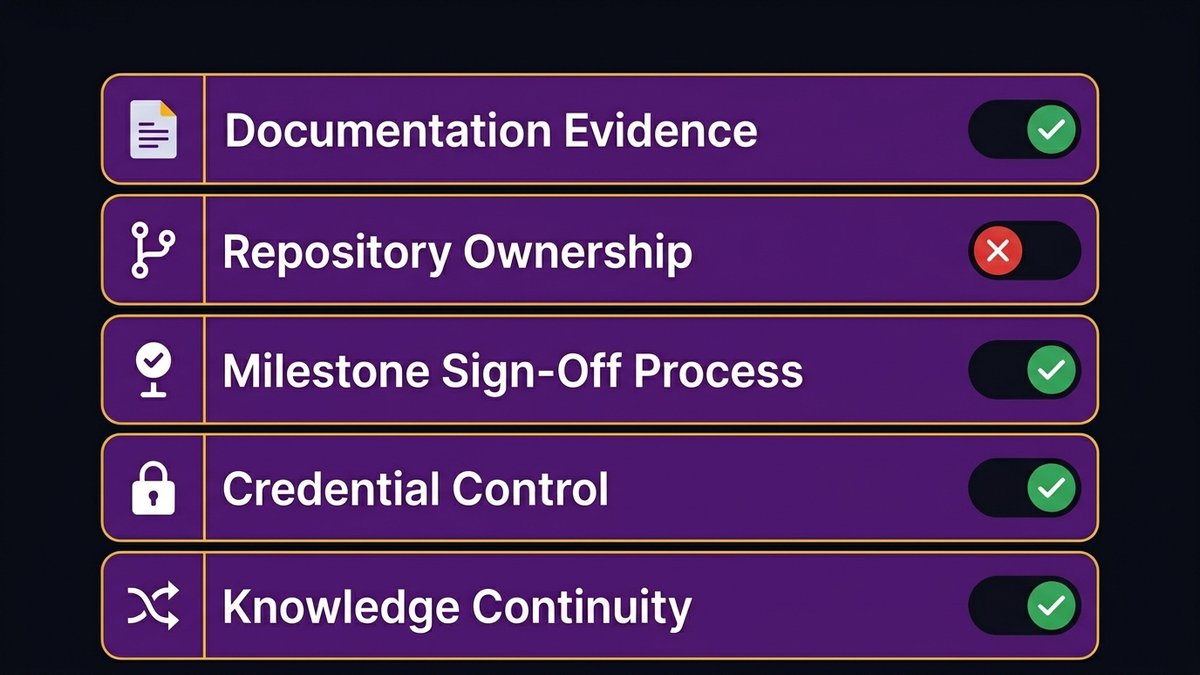
RFP and proposal evaluation criteria for vendor accountability, including documentation standards and IP transfer track record.
Red Flags to Evaluate at the RFP and Proposal Stage
Five questions separate vendors with genuine documentation practices from those who will promise anything to close the deal:
1. Can you show us documentation from a recently completed project?
Not a template. Not a sample. Actual documentation from actual work. A vendor with real documentation practices can produce a sanitized example. A vendor without them will deflect, offer a generic checklist, or produce something that looks like a marketing brochure.
2. Where do your clients’ repositories live during the engagement?
If the answer is “in our GitHub organization,” the client doesn’t have ownership. If the answer is “in the client’s repository from day one,” they do. There’s no correct answer that isn’t the second one.
3. What’s your process for documentation sign-off at milestone completion?
A specific, named process is a signal. “We document as we go” is not a process. It’s a hope.
4. Who holds the production environment credentials during the engagement?
Client-owned accounts from day one, with vendor access granted, is the only safe structure. Shared accounts or vendor-owned accounts are a lock-in risk regardless of IP clauses.
5. What happens to the system if your team changes significantly mid-engagement?
How the vendor answers this question tells you whether they’ve given serious thought to knowledge continuity. A vendor who can’t explain their knowledge transfer process for internal turnover definitely doesn’t have one for client handover.
What Mandatory Documentation Transfer Looks Like as a Structural Requirement
Mandatory documentation transfer isn’t a clause in a contract. It’s a condition of the engagement’s structure. Every sprint closes with a documentation update. Every milestone sign-off includes a documentation review. Documentation quality counts as part of delivery quality, not an optional context bolted on afterward.
A vendor who balks at this structure is telling you something important: documentation isn’t part of how they work. The conversation about their documentation practices during the sales process is your clearest signal about what the handover will look like.
How Nexa Devs Builds Documentation Transfer Into the Engagement Structure
The vendor-disappearance scenario this post describes (a working system, no documentation, no path to maintenance) is the specific failure mode that Nexa Devs was designed to prevent.
Documentation at Nexa isn’t a handover artifact. It’s a delivery standard. Every engagement produces UML architecture diagrams, system design documents, API references (Swagger/Postman), user story libraries, and test coverage reports as part of the normal delivery process. Those documents are unconditionally client-owned, not held pending contract renewal, and not contingent on post-launch engagement. The client has complete documentation from day one of the engagement, updated through every sprint.
The repository structure follows the same principle. Client-owned repositories, client-owned accounts, client-owned production environments from the start. Nexa engineers work in client systems, not the other way around.
For systems without documentation, including those built by other vendors and in poor condition, Nexa supports rescue and ongoing maintenance under the same SLA-based model. The starting point doesn’t have to be clean. The ending point does.
If you’re currently in a post-disappearance situation or approaching the end of a vendor relationship and worried about what the handover will look like, the conversation starts with a call.
Contact Nexa Devs to discuss a documentation audit or rescue engagement
FAQ
What should a handover document include?
A complete software handover document includes source code repository access with full commit history, architecture documentation, API references, database schema documentation, environment configuration, deployment instructions, third-party credentials transferred to client-owned accounts, automated test suites, and a signed IP assignment confirming all assets transfer to the client.
What is the document handover process?
Document handover in software development is the structured transfer of all documentation, code, credentials, and access rights from a vendor to the client or incoming team. A well-run process transfers these assets at each milestone sign-off rather than in a single bundle at project close.
What is an exit strategy for vendors?
A vendor exit strategy is a contractual and operational plan that defines how knowledge, code, credentials, and access transfer to the client when the relationship ends. It includes a documentation maintenance schedule, provisions for client-owned repositories, credential transfer requirements, and a defined handover acceptance process.
How to hold a vendor accountable?
Hold vendors accountable through contract structure: require milestone-linked documentation delivery, make documentation acceptance a condition of milestone payment, require client-owned repositories and production accounts from day one, and include an audit right to verify the completeness of documentation at any point during the engagement.
How to prove ownership of code?
Code ownership requires a signed IP assignment or work-for-hire clause, plus client-owned repositories and production accounts. A signed IP assignment without operational control is incomplete: if the vendor controls the accounts or holds the only operating knowledge, the legal transfer is not yet practically effective.
Who should be responsible for vendor oversight?
Vendor oversight sits with whoever owns the budget decision, typically the CEO or CTO in a mid-market organization. Day-to-day accountability should be assigned to a named internal contact who reviews milestone deliverables, including documentation packages, before authorizing payment.
by Sarah Mitchell | Jul 9, 2026 | Business and Technology
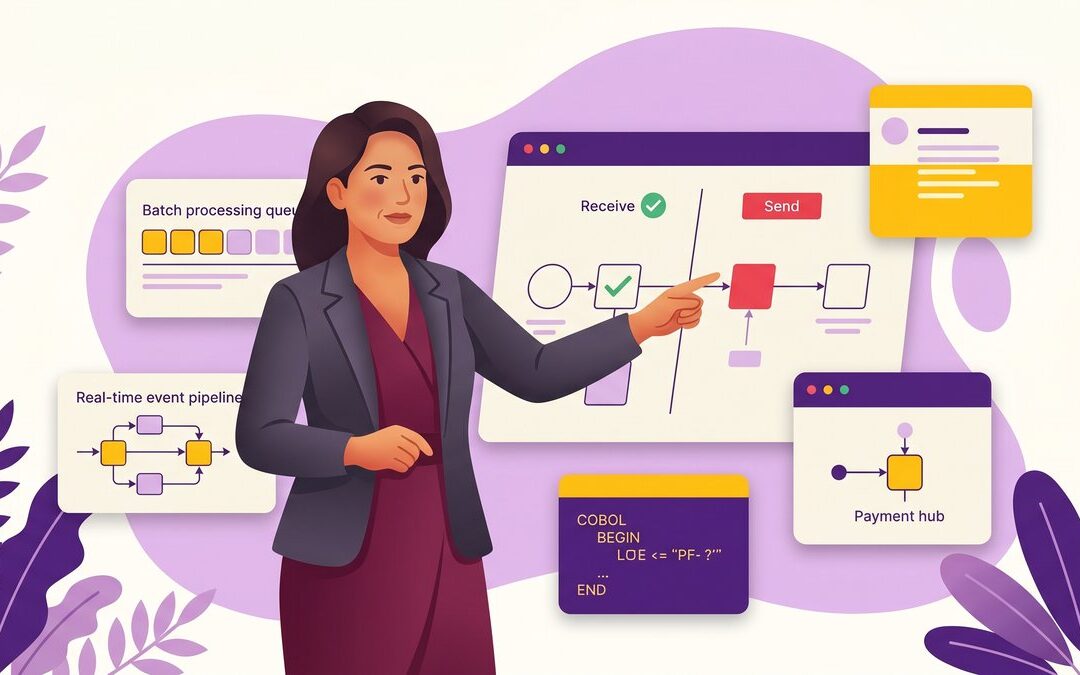
Core Banking Modernization: The FedNow Send Gap Mid-Market Banks Can’t Ignore
Your bank is live on FedNow. Customers can receive instant payments. The press release went out. The board checked a box.
Then a business client asked to send a payroll disbursement via FedNow. And the answer was no.
That asymmetry, receive-yes and send-no, is not a payments department problem. It’s a core infrastructure diagnostic. Your core system can’t process a send transaction in real time because it was built around a fundamentally different architecture: one designed for a world where money moved overnight, not instantly. The same architectural constraint that blocks real-time payment sends also explains why your AI modernization initiatives have stalled, why your compliance reporting is getting harder, and why your most operationally sophisticated business clients are quietly paying attention.
This guide is for CEOs and CTOs at mid-market banks (roughly $1B to $10B in assets) who want to understand what the FedNow send gap actually signals, what the three realistic modernization paths look like, and how to diagnose where your core stands before your next board meeting.
1. Most mid-market banks can receive FedNow payments but can’t send them. The gap comes from batch-processing core architecture, not a settings problem.
2. The send gap is a diagnostic: if your core can’t send real-time payments, it can’t support real-time AI, modern compliance reporting, or digital-first business accounts.
3. Three paths exist: full core replacement (3-5 years, high risk), sidecar core (run modern alongside legacy), or payment hub wrapper (an API layer that buys time without locking you in).
4. Accenture’s 2026 banking survey puts 70% of bank IT budgets toward maintaining technical debt. The cost of staying put compounds annually.
5. Sidecar and API-layer approaches can achieve FedNow send capability in months, not years.
The Asymmetry Your Board Should Be Asking About: You Can Receive, But You Can’t Send
Your board may not have asked this question yet. Most haven’t. But the gap between receive participation and send capability at mid-market banks is one of the clearest signals of core system readiness you can get without a full technical audit, and it’s hiding inside your FedNow enrollment status.
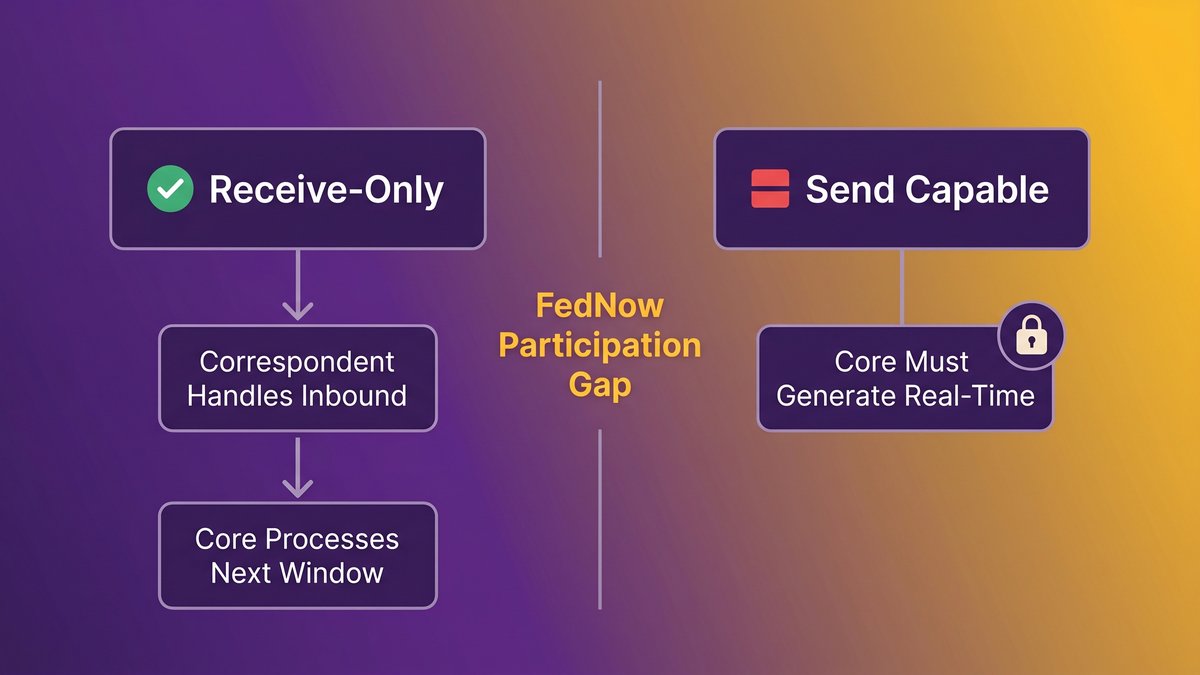
A diagram showing the asymmetry between FedNow receive-only and full send/receive participation across mid-market bank tiers.
Receiving FedNow payments doesn’t require real-time processing. Your correspondent bank or FedNow-certified service provider handles the inbound transaction. Your core processes it during the next available window. It looks like instant payments. It isn’t. The moment you need to send, your core must generate, validate, and clear a transaction in real time. Most legacy cores weren’t built for that.
How receive-only FedNow participation became the easy default
When FedNow launched in 2023, the Federal Reserve structured onboarding to allow receive-only participation. Banks could claim instant payment capability, satisfy early regulatory questions, and satisfy their boards without touching their core systems. For institutions managing constrained IT budgets, this was an attractive option. Receive-only participation is genuinely useful: it lets customers get paid instantly even if the bank hasn’t addressed the harder infrastructure work.
But receive-only became the default for a reason that has nothing to do with strategy. It’s all that many legacy cores can technically support. Enabling send requires the core to operate in a fundamentally different mode. The architectural difference between “can receive” and “can send” is the difference between a passive participant and an active one. Active participation exposes exactly what the legacy system can and cannot do.
What it actually means when your core can’t support send: a technical plain-English explanation
Legacy core banking systems were built on a batch processing architecture. At a defined interval, usually overnight, the system collects all pending transactions, processes them in sequence, and updates account balances. FedNow send requires something different: when a business customer initiates an instant payment, your core system needs to validate available funds, generate the transaction message, submit it to FedNow, receive confirmation, and update the account ledger, all within seconds.
A batch-processing architecture can’t do this. The core doesn’t have a transaction pipeline that works that way. This isn’t a configuration issue or a vendor update. It’s a design philosophy baked into systems that, in many cases, include code written before the year 2000. A CIO study cited by The Financial Revolutionist found 63% of banks still rely on pre-2000 code, a figure consistent with how long the dominant core banking platforms have been in production. The design assumptions of those platforms didn’t include real-time clearing because real-time clearing didn’t exist when they were built.
Legacy system AI integration
Batch vs. Real-Time: Why Your Core Processes Money the Way a 1985 Mainframe Does
Batch processing works by accumulating transactions and processing them in bulk at scheduled intervals. End-of-day settlement, overnight clearing, and next-day balance updates are all artifacts of this architecture. The design made sense when wire transfers and ACH were the fastest payment mechanisms available, and when computing resources were too expensive to run continuously.
The architecture of batch processing and why it fundamentally blocks send capability
A batch core maintains a queue. Transactions sit in that queue until the processing window opens. The core isn’t listening for incoming events in real time. It isn’t running a continuous reconciliation loop. It processes when scheduled, not when triggered.
Real-time payments require an event-driven architecture. The moment a transaction request arrives, the system needs to respond: check balance, validate, authorize, submit, confirm, and update. All of that in under five seconds. A queue-based system can’t close that loop. The processing model is incompatible at the architecture level, not the feature level.
What “end-of-day settlement” actually costs you in 2026
There’s a line-item cost and a competitive cost. The line-item cost is operational overhead: exceptions, manual reconciliation, the staff hours that go into managing settlement windows. These are real but often absorbed into overhead without being named.
The competitive cost is more significant. Business customers running payroll, managing cash positions, or operating across multiple markets increasingly expect intraday finality. A regional competitor running a modern core, or a fintech-as-a-service platform, can offer it. When your business clients notice the gap, they don’t call to complain. They open a second account somewhere else.
Accenture’s 2026 banking survey found that 70% of bank IT budgets go toward maintaining technical debt. That figure includes the operational overhead of working around batch processing limitations. The real cost of end-of-day settlement isn’t just the settlement itself. It’s everything your organization does to compensate for not having a real-time core.
What the Send Gap Is Actually Telling You: Three Downstream Risks Beyond Payments
The FedNow send gap matters for payments. But a CTO who frames it only as a payments problem is reading the signal wrong. The same architectural limitation that prevents real-time payment sends also predicts your position on three other dimensions: AI integration capacity, regulatory compliance posture, and competitive account retention.
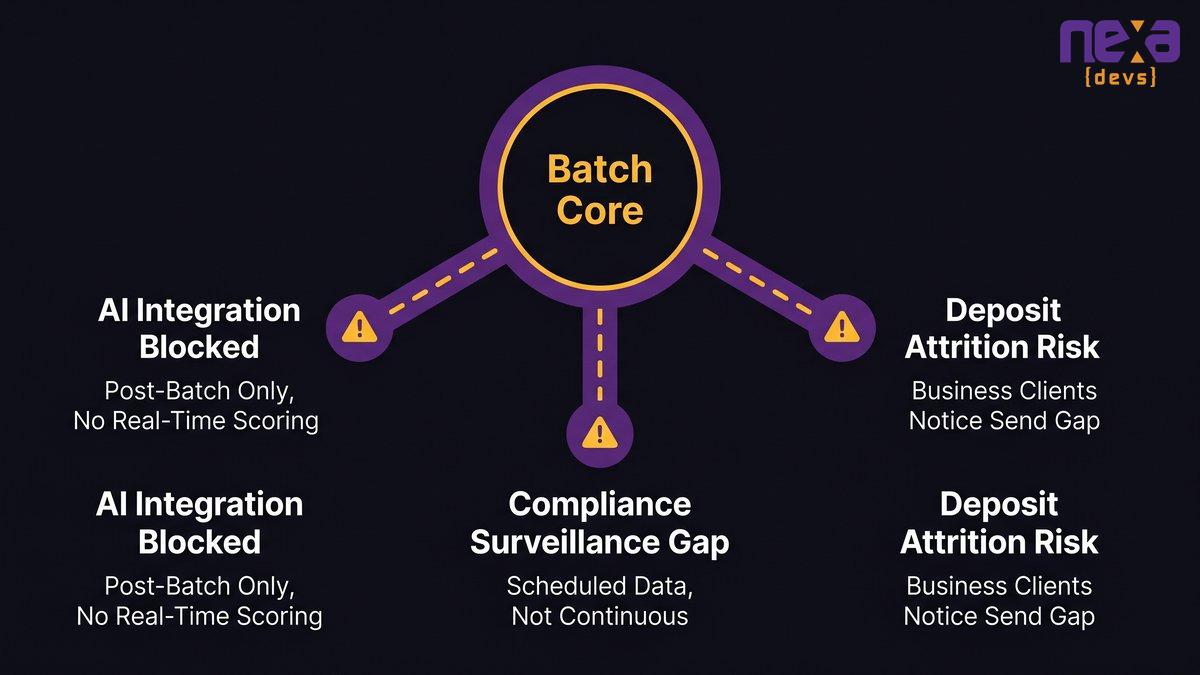
Three downstream risk areas connected to legacy batch-processing core architecture at mid-market banks.
AI integration readiness: why a batch core can’t support real-time model inference
A fraud detection model that scores transactions in real time needs to operate in the same event-driven environment as the transaction itself. The model receives a transaction event, evaluates it, returns a score, and influences the authorization decision, all before the transaction clears. A batch core doesn’t generate those events in real time. The model has nothing to score until the batch runs.
This is why AI projects at banks with legacy cores consistently stall at the pilot stage. The pilot environment simulates event-driven behavior. Production doesn’t support it. When the pilot works and deployment doesn’t, the gap is almost always infrastructure, not model quality.
The IBM Institute for Business Value’s 2025 survey of banking CIOs found that less than half reported meaningful gains on desired business benefits from core modernization programs. The reason isn’t failure of ambition. Modernization attempts that don’t address the batch-vs-real-time architecture gap produce incremental improvements on top of a fundamentally limiting foundation.
Regulatory compliance posture: what examiners are starting to ask about real-time infrastructure
Bank examiners are asking about real-time monitoring and reporting capabilities: BSA/AML compliance, liquidity management, and operational risk. A batch-processing core generates compliance data on a scheduled basis, not a continuous one. This creates surveillance gaps that examiners are trained to identify.
This pressure will increase as regulators align their own systems with real-time infrastructure standards. A mid-market bank that hasn’t addressed batch limitations will face growing examiner friction on compliance reporting, regardless of whatever front-end investments it has made.
Competitive deposit attrition: when your business customers notice
Mid-market businesses, the commercial accounts that generate a disproportionate share of fee income and deposit balances, are run by people who understand operational technology. They know what instant settlement means for cash management. And increasingly, they have options.
Fintechs and digital-first banks have no legacy core constraint. Regional banks that have completed or partially completed core modernization are competing for exactly these accounts. The commercial clients who notice the send gap first are the ones you can least afford to lose.
Core banking API layer
The Three Paths Mid-Market Banks Are Taking: Honest Tradeoffs
Three modernization paths dominate the conversation at banks in the $1B to $10B asset range. Each has genuine merit and genuine risk. Any consultant who presents only one option without acknowledging the others is optimizing for their own product, not your situation.
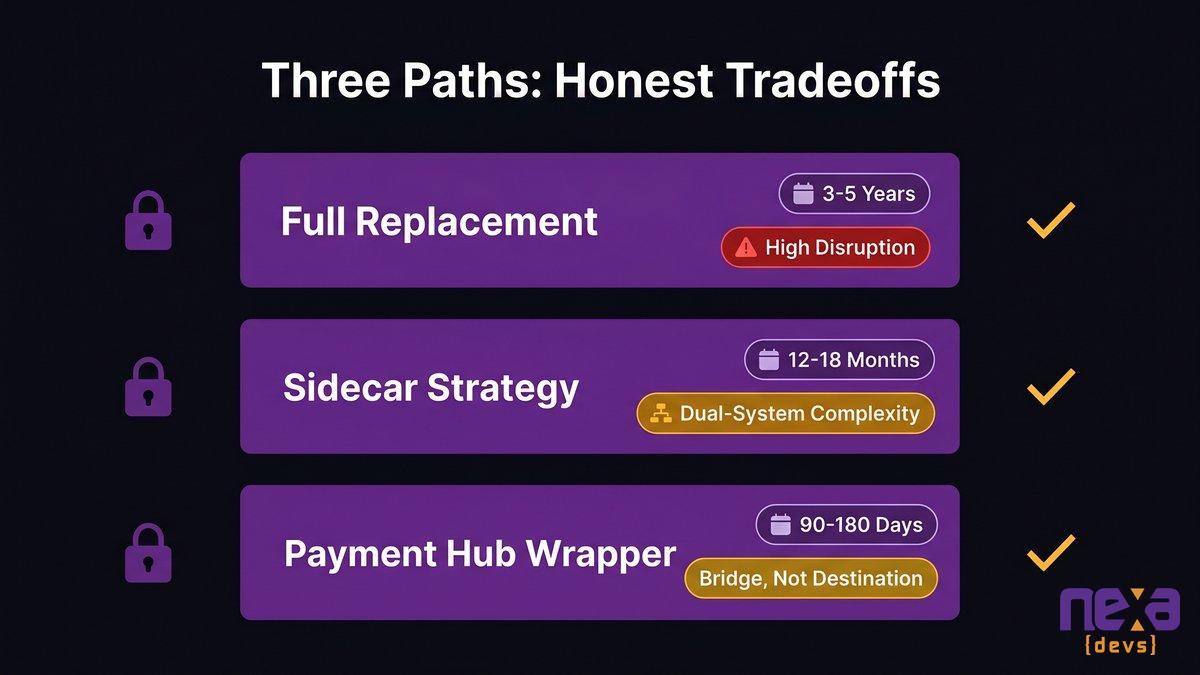
Comparison of three core banking modernization paths: full replacement, sidecar strategy, and payment hub wrapper, with timeline, cost, and risk tradeoffs.
Path 1: Full core replacement (the 3-to-5-year commitment most boards aren’t ready for)
Full replacement means selecting a next-generation core banking platform and migrating all accounts, transactions, and data from the legacy system to the new one. When it works, the outcome is a clean slate: event-driven architecture, API-first design, cloud-native infrastructure, and full support for FedNow send, real-time AI, and modern compliance reporting.
The risk profile is significant. The Kansas City Federal Reserve’s analysis of core banking modernization options identifies full replacement as the highest-disruption path, requiring years of parallel operation, complex data migration, and a cutover event that carries material operational risk. IBM IBV’s 2025 data adds context: 73% of banking CIOs said managing costs became harder after modernization attempts, and less than half reported meaningful gains on their original business benefits.
Full replacement is the right answer when the legacy system is genuinely unrepairable, when the organization has the capital and executive bandwidth to absorb a multi-year migration, and when the board holds realistic expectations about timeline and disruption. For most mid-market banks with constrained IT budgets and limited staff, it isn’t the starting point.
Path 2: The sidecar strategy (run modern alongside legacy, no cutover day)
The sidecar approach deploys a modern core alongside the existing legacy platform rather than replacing it. New products and new account types run on the modern system. Legacy products stay on the old one. Over time, as accounts migrate and products sunset, the balance shifts.
The sidecar addresses FedNow send directly: new business accounts or payment types run through the modern sidecar, which has the event-driven architecture required for real-time processing. The legacy core keeps handling existing accounts without disruption.
The tradeoff is operational complexity. Running two cores means managing two systems, two data models, and synchronization logic between them. For banks with limited IT capacity, that overhead is real. The sidecar is a risk-managed path, not a simple one.
Path 3: Payment hub wrapper, an API abstraction layer that buys you time without locking you in
The payment hub approach doesn’t replace the legacy core. A payment hub or API middleware layer sits between the core and the payment network. The hub handles the real-time event processing FedNow send requires, translates between real-time protocols and the batch logic of the legacy core, and delivers the capability without requiring the underlying system to change.
This path gets a bank to FedNow send capability in the shortest timeline, often 90 to 180 days. It also preserves optionality: the abstraction layer doesn’t lock the bank into a specific future modernization path.
The honest limitation: the hub is a bridge, not a destination. It doesn’t solve the batch architecture problem; it routes around it. AI integration, real-time compliance monitoring, and the full commercial account experience all eventually require the core to change. The hub buys time and capability. It doesn’t eliminate the underlying constraint.
Why Sidecar and API-Layer Approaches Succeed Where Full Replacement Fails
A full core replacement has failed at enough institutions (on timeline, cost, and business case) that treating it as the default option is operationally reckless for most mid-market banks. Sidecar and API-layer approaches have a better track record for a structural reason: they don’t require everything to go right simultaneously.
Why legacy core operating costs make full replacement financially hard
Accenture’s 2026 banking survey captures the pattern: 70% of bank IT budgets consumed by technical debt maintenance, leaving 30 cents of every IT dollar available for anything else. That ratio makes full replacement financially difficult. Banks spending the majority of their technology budget on maintenance don’t have the capital available for a 3-to-5-year parallel-system migration. They need a path that produces capability and cost relief on a shorter timeline.
Galileo Financial Technologies’ analysis of operating costs suggests legacy core expenses can run roughly 10 times higher than modern system equivalents once you account for maintenance, exception handling, and integration overhead. This is a vendor-sourced figure, so treat it as directional, but the directional point aligns with what the Accenture data captures: the maintenance burden is the constraint that makes everything else harder.
The COBOL retirement problem: what happens when your last legacy maintainer leaves
The Financial Revolutionist, citing a CIO study, found over three-quarters of banks have only one or two people capable of maintaining their legacy code. The Open Mainframe Project’s 2020 analysis put the average COBOL programmer age at 58, with approximately 10% retiring annually. That retirement curve has been running for six years since that analysis was published.
“unquantifiable risk of retiring domain experts whose institutional knowledge is embedded in undocumented, bespoke COBOL business logic, making simple mid-tier maintenance a cascading operational liability.”
When the last person who understands how the core works retires, the bank faces a knowledge loss event that makes any modernization approach dramatically more expensive and risky. The window for a knowledge-guided incremental migration is narrowing. Every bank running on legacy cores is somewhere on that staffing curve, and the curve is running in one direction.
How incremental approaches get to FedNow send in months, not years
A payment hub wrapper can be scoped, built, and validated in 90 to 180 days for a mid-market bank with a reasonably documented API surface. The sidecar approach takes longer, typically 12 to 18 months before meaningful account migration begins, but neither timeline resembles the 3-to-5-year commitment of full replacement.
The timeline advantage compounds. Every month on a legacy core with no FedNow send capability is a month where commercial account attrition can accelerate, where examiner friction on real-time reporting grows, and where the competitive gap with digital-first alternatives widens. An incremental path that delivers FedNow send in Phase 1 and keeps modernization moving in subsequent phases captures business value faster than a replacement project that delivers nothing until cutover.
What “Execution Without a 3-Year Shutdown” Actually Looks Like
Strategy only matters when it connects to an implementation model. This section covers what incremental core modernization actually looks like at a mid-market bank: the sequencing, the architecture, and the real preconditions.
The phased migration model: peripheral systems before the core
Start with peripheral systems, the systems that interact with the core but don’t constitute it. Online banking interfaces, mobile apps, reporting pipelines, fraud detection layers. Modernizing these doesn’t require touching the core’s transaction processing logic. It builds the skills, patterns, and organizational confidence needed when the core itself is on the table.
Peripheral modernization also produces measurable business value early. A modern mobile banking interface runs faster and supports richer features. A cloud-based reporting pipeline produces compliance data on a shorter cycle. Each peripheral win reduces the dependency on the legacy core, makes the eventual core migration smaller in scope, and funds the modernization roadmap with demonstrated ROI.
API abstraction layer as a translation bridge: how it works in practice
A FedNow send request arrives at the payment hub. The hub validates, formats, and submits the transaction to FedNow in real time. It then posts a ledger entry to the legacy core through whatever mechanism the core supports, often a queued API or file-based interface. The core processes the ledger entry in its next available window.
There’s a short reconciliation gap between when FedNow confirms the transaction and when the legacy core’s ledger reflects it. For most payment types, this gap is operationally acceptable. The point is that the gap is manageable, and far smaller than the gap between having FedNow send capability and not having it.
What a mid-market bank realistically needs to have in place before starting
Three preconditions matter most. First, documented core APIs: the abstraction layer needs something to connect to. If the legacy core has no documented API surface, mapping it is the actual first step. That’s a scoping exercise, not a modernization project, but it needs to happen before technical work begins.
Second, a clear FedNow certification path: if the bank hasn’t begun FedNow send certification with its service provider, that process runs in parallel with the technical build.
Third, an internal technical owner: someone on the bank’s side who understands the core well enough to validate integration logic and approve testing milestones. They don’t need to be a core banking architect. They need to understand the core’s transaction model and have the authority to make decisions during implementation.
These preconditions can be assessed in a few weeks. If they’re not in place, the modernization project starts with a documentation and scoping phase, not a build phase.
How to Diagnose Your Own Core Readiness in 30 Minutes
If you’re a CTO at a mid-market bank, you should be able to answer every question below without pulling up a vendor presentation. If you can’t answer them, that inability is itself the answer.
Five questions your CTO should answer before your next board meeting
1. Does your core support API-based transaction initiation, or does it require file-based input?**
A core that accepts transactions only via file upload or batch input cannot support real-time payment send without an abstraction layer. If the answer is “file-based” or “I’m not sure,” your FedNow send path requires a hub, not a direct integration.
2. What is the batch processing cycle: when does your core run, and how long does a cycle take?**
A nightly batch that runs for four hours means four hours per day, where real-time response is structurally impossible. Understanding the batch cycle tells you the exact constraint you’re working around and how much it matters for your specific payment use cases.
3. How many people in your organization can modify core transaction processing logic?**
One or two people is both a staffing risk and a modernization constraint. When those individuals retire or leave, the knowledge required to safely implement any modernization path leaves with them. The number doesn’t need to be large. It must be more than one.
4. When you run AI or analytics models in your environment, are they scoring transactions in real time or post-batch?**
Post-batch scoring means your fraud detection, credit models, and any other analytical tools are running on data that’s already hours old. Real-time scoring requires real-time data pipelines. If the answer is post-batch, your AI investments have an architecture ceiling they haven’t reached yet.
5. In your last regulatory examination, were there any findings related to real-time monitoring or surveillance coverage gaps?
Examination findings on monitoring gaps often trace directly to batch processing limitations. This question surfaces compliance risk that may already be in an open finding, and that a phased modernization program can address directly.
What your FedNow participation status actually reveals about your modernization posture
Receive-only or not yet onboarded means your core hasn’t been tested against real-time send requirements. It’s the starting position for most mid-market banks, and it’s recoverable. The diagnostic value is in understanding why the limitation exists. Is it architecture, budget, or decision? Which path forward fits your specific constraints?
Finzly, a payments technology vendor (with commercial interest in this figure), reported that nearly three-quarters of financial institutions cite moderate to severe challenges with legacy systems in handling instant payments send. The receive/send gap is not a minority problem at mid-market banks. It’s the baseline condition. The question is what you do with it.
What This Means If You’re Ready to Move
Sitting on receive-only FedNow participation isn’t a neutral holding position. Commercial clients who need instant outbound payments will find a bank that can send them. Your examiners will notice the real-time reporting gaps. And every AI initiative that needs event-driven data will hit the same ceiling, over and over, until the infrastructure changes.
The FedNow send gap is diagnostic, not merely operational. It tells you precisely where your core’s architecture ends and where the modernization work begins. That clarity has real value: you can scope the problem, sequence a response, and choose a path that delivers capability in months rather than years.
Nearshore beats offshore for most mid-market bank modernization projects, and a phased approach beats full replacement for most institutions in the $1B to $10B range. Both positions are based on the same logic: scope risk to what you can execute, prove value before expanding, and keep the existing system running while you build something better alongside it.
Nexa builds and deploys the middleware and API-layer components that connect legacy banking infrastructure to modern payment networks and AI-ready systems, without requiring a multi-year core replacement project. Every engagement delivers complete documentation that your team owns, backed by SLA-based ongoing support.
FAQ
Why are banks slow to adopt FedNow send capabilities?
Most mid-market banks cannot enable FedNow send without modifying their core banking architecture, which operates on batch processing designed decades ago. Receive-only participation is easier because it does not require the core to generate real-time transactions. Enabling send exposes the architectural limitation directly, and fixing it requires either an abstraction layer or partial core modernization, both of which require budget and planning.
What is the difference between FedNow receive-only and send participation?
Receive-only means your bank can accept instant payments from other institutions. Your core processes them in the next batch window, but customers see funds arrive quickly. Sending participation means your core can generate and submit instant payment instructions in real time. Send requires event-driven processing capability that many legacy cores do not have.
What is a sidecar core banking strategy, and how does it work?
A sidecar deploys a modern core banking system alongside your existing legacy platform rather than replacing it. New products and account types run on the modern system, while the legacy core keeps handling existing accounts. Accounts migrate incrementally over time, avoiding a single high-risk cutover. The tradeoff is complexity: two systems require two data models, synchronization logic, and additional operational overhead.
How does legacy core banking infrastructure prevent real-time payment processing?
Legacy cores are built on a batch processing architecture. They collect transactions in a queue and process them at scheduled intervals, typically overnight. FedNow send requires real-time event-driven processing: the core must respond within seconds. A batch core cannot do this. The constraint is architectural design, not a missing feature.
What is the cost of maintaining a legacy core banking system vs. modernizing?
Accenture’s 2026 banking survey found 70% of bank IT budgets go toward technical debt maintenance. Incremental approaches, including payment hub wrappers and sidecar strategies, can deliver FedNow send in 90 to 180 days and begin shifting the maintenance ratio. Full core replacement takes 3 to 5 years but delivers a clean architectural slate when executed successfully.
How long does core banking modernization typically take for a mid-market bank?
Full core replacement takes 3 to 5 years. A payment hub wrapper enabling FedNow send can typically be delivered in 90 to 180 days for a bank with a documented API surface. A sidecar approach takes 12 to 18 months before meaningful account migration begins. IBM IBV 2025 data found less than half of banking CIOs reported meaningful gains from modernization attempts, which is why path selection matters as much as speed.
by Sarah Mitchell | Jul 7, 2026 | Business and Technology
Cyber Insurance AI Denial: Why Shadow AI Costs You the Claim
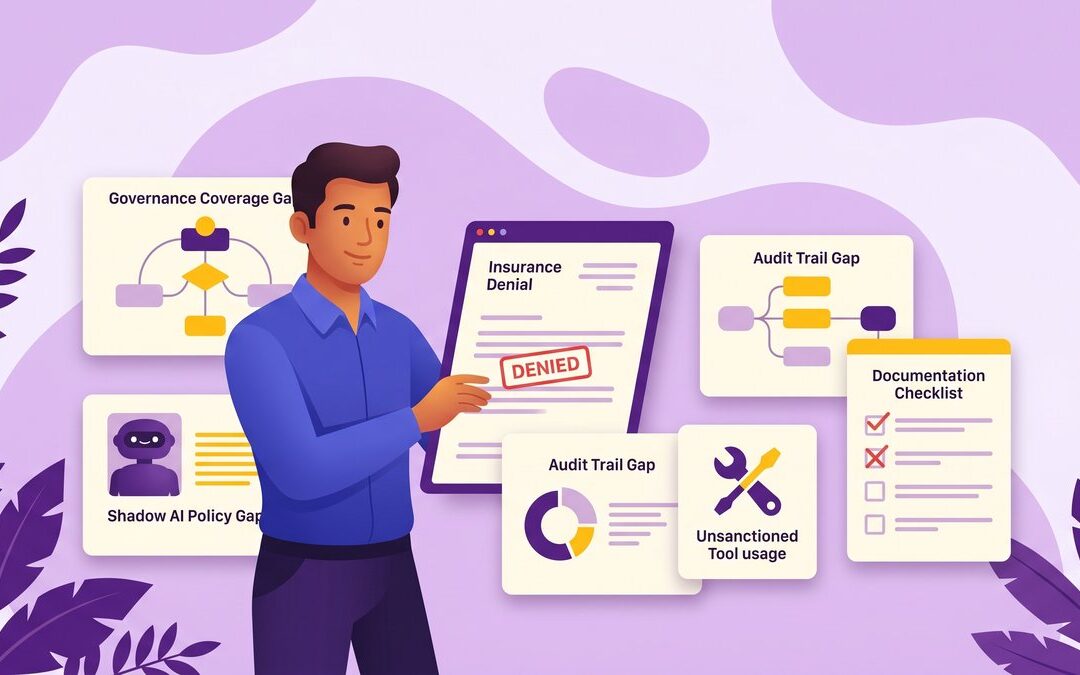
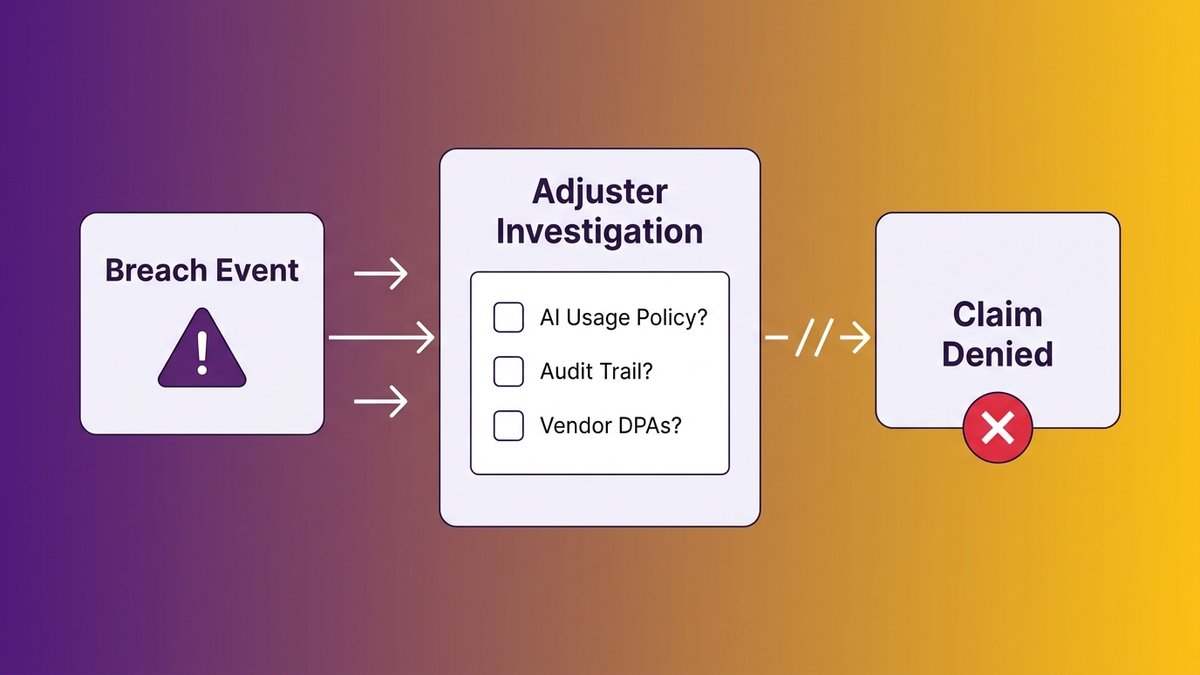
Your company gets breached. Customer data is exposed. You file the cyber insurance claim you’ve been paying for. Then the adjuster asks one question: can you show us your AI usage policy and the audit trail proving your employees followed it?
You can’t. Neither can most mid-market companies right now. The claim gets denied.
Cyber insurance AI denial is no longer hypothetical. Insurers are rewriting underwriting criteria in 2026, and AI governance documentation has become a primary signal during both renewals and claim investigations. A breach that would have paid out last year may not pay out this year, not because the breach was worse, but because shadow AI activities were present and undocumented. For a 200-person company, that gap can mean the difference between recovering and not.
What insurers now examine during a claim: AI governance documentation, audit trails, and usage policy compliance records alongside traditional breach evidence.
The Claim Your Policy Won’t Cover
Insurance denial rarely announces itself as “you used AI wrong.” It arrives in policy language, a clause about “reasonable security controls,” a “failure to document preventative measures” exclusion, or an explicit AI usage rider added at renewal without anyone noticing. By the time you’re reading the denial letter, the breach has already happened.
When governance documentation is the missing piece
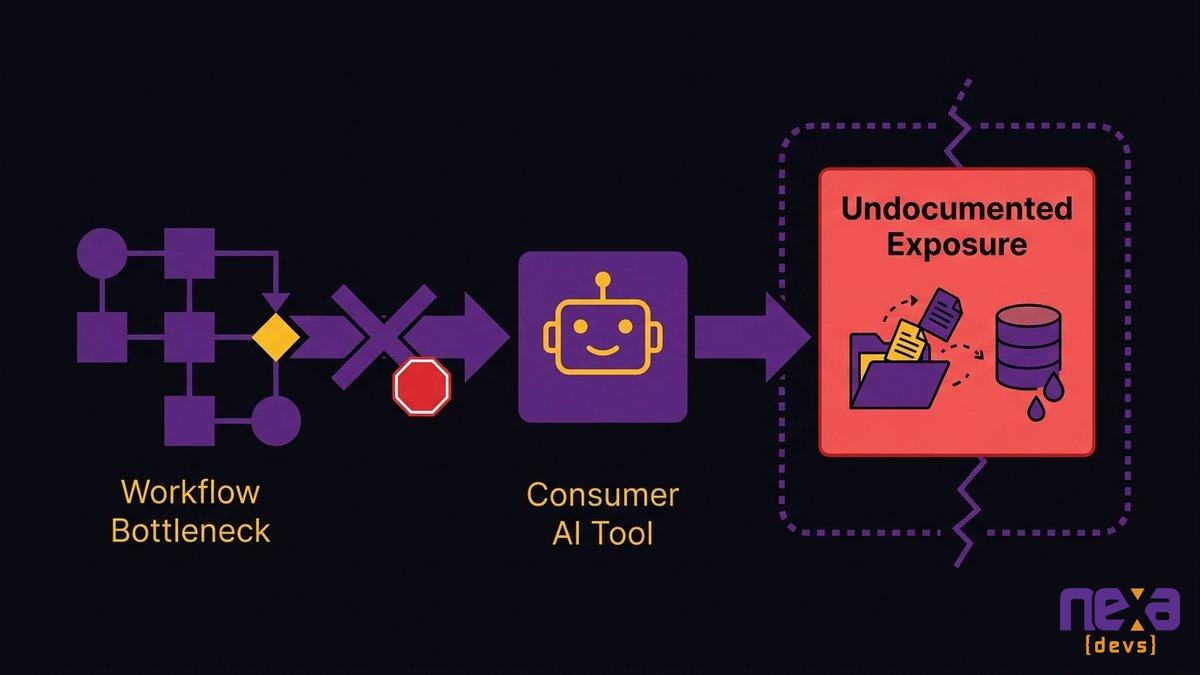
The mechanism works like this. A data breach occurs, and the investigation reveals that an employee pasted customer records into a consumer AI tool to generate a report. That tool’s privacy policy allowed training on user inputs. The insurer has grounds, not necessarily because the policy says “we won’t cover AI,” but because the absence of any governance documentation signals a failure in the security controls your application certified you maintained.
Cyber insurance applications ask you to certify your security posture. You tick the boxes: multi-factor authentication, endpoint protection, incident response plan, employee security training. You don’t tick a box labeled “unsanctioned AI usage policy” because that box doesn’t exist yet on most applications. But when a breach investigation surfaces that employees were routing sensitive data through unmonitored consumer AI platforms, the adjuster can argue that your certified security controls were incomplete.
The documentation gap is the primary denial trigger. Insurers aren’t denying claims because AI was used. They’re denying them because policies were absent, audit trails didn’t exist, and no one could reconstruct what data went where.
Why mid-market companies are disproportionately exposed
A Fortune 500 company has a full-time CISO, a legal team that reviews every policy renewal, and an IT department that audits software provisioning. Your 200-person company has a shared IT director, a CEO who signs the insurance renewal after a 10-minute review, and operations teams who figured out that ChatGPT is faster than the internal reporting tool nobody updated in three years.
That’s not a failure of character. It’s a structural exposure that affects mid-market companies specifically. Enterprise companies have governance infrastructure. Small companies fly under the radar on size alone. Mid-market companies sit in the worst position: large enough to carry significant sensitive data, small enough to lack the governance layer insurers now expect to see documented.
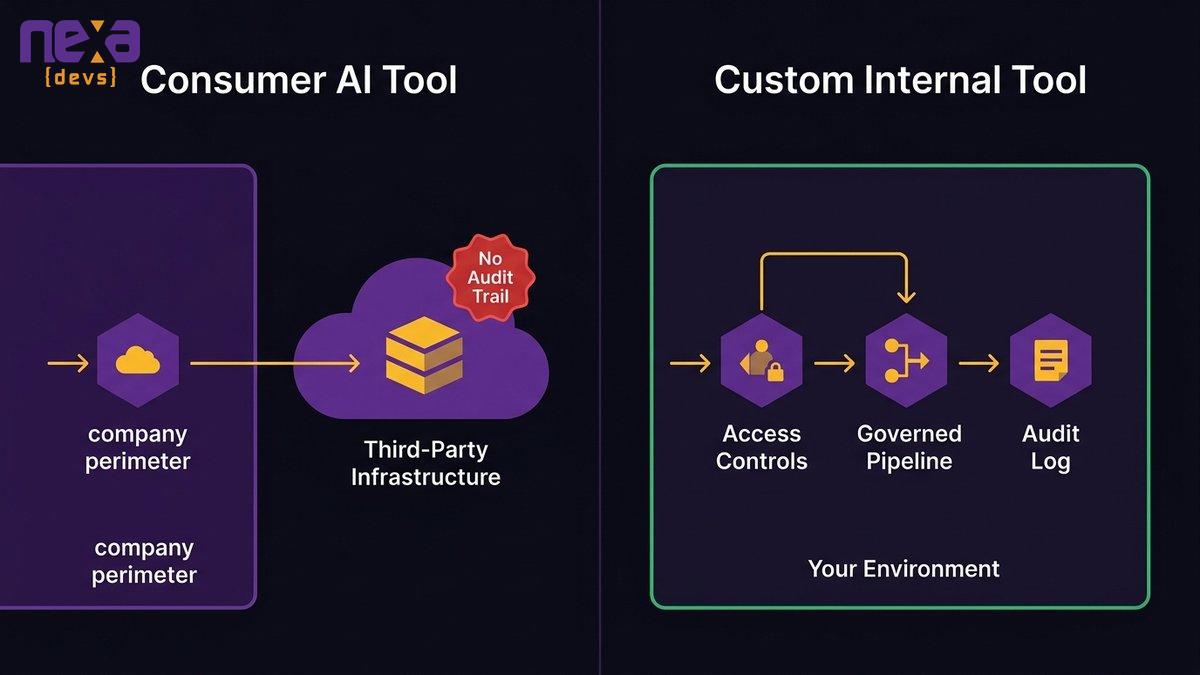
Shadow AI Is Not a Security Team Problem, It’s an Operations Problem
Your operations teams didn’t adopt ChatGPT or Perplexity because they wanted to create a compliance problem. They adopted them because your internal tools couldn’t do what they needed fast enough. Shadow AI enters through workflow gaps, not IT failures. That distinction determines who owns the fix.
Picture your finance coordinator. She needs to summarize 40 vendor contracts before a board meeting. The internal document management system is slow, the search function is broken, and the vendor locked you out of the AI feature unless you upgrade your plan. She opens a consumer AI tool, pastes the contract text, and gets the summary she needs in 90 seconds.
No malicious intent. No policy she was aware of violating. No record in any system that vendor contract data, which may include pricing terms, payment clauses, and third-party obligations, just passed through a consumer AI model with a data retention policy your legal team has never reviewed.
That’s the shadow AI story in most mid-market operations. Not a rogue employee. Not an IT failure. A workflow gap that a consumer AI tool filled faster than anyone anticipated.
Gartner’s 2023 cybersecurity predictions put the trajectory plainly: by 2027, 75% of employees will acquire, modify, or create technology outside IT’s visibility, up from 41% in 2022. The consumer AI wave accelerated this curve faster than almost anyone predicted.
The typical shadow AI entry path: an operations workflow bottleneck leads an employee to a consumer AI tool, creating an undocumented data exposure point outside IT visibility.
The difference between shadow IT and shadow AI (and why shadow AI scales faster)
Shadow IT has existed for decades. The finance team installs Dropbox. Marketing subscribes to a SaaS tool IT didn’t approve. IT eventually discovers it, evaluates it, and either sanctions or removes it. The risk surface is proportional to the number of users.
Shadow AI works differently. A single employee who builds a workflow using an AI tool can expose thousands of customer records in one session. The risk surface isn’t proportional to users. It’s proportional to what the tool processes. A finance analyst running a revenue model through an unapproved AI platform isn’t one person’s risk. It’s your entire customer financial dataset’s risk, processed without an audit trail, by a vendor whose data handling practices you’ve never reviewed.
CIO Dive’s reporting on Torii’s 2026 SaaS Benchmark Report found that only about 15% of discovered applications in enterprise environments are fully sanctioned by IT, with more than 61% lacking formal approval or oversight. AI tools accelerate this ratio because the barrier to adoption is effectively zero.
What Insurers Are Actually Looking for During Renewals
Renewal questionnaires have changed. The prior year’s version asked about firewalls, MFA, and patch management. This year’s asks about AI. Most mid-market CEOs are answering those questions without fully understanding what the underwriter is scoring.
AI governance documentation as an underwriting signal
When underwriters ask about AI, they’re looking for three things. Do you have a written AI usage policy naming approved tools, data access rules, and enforcement ownership? Do you have an audit mechanism, any documented mechanism, for identifying what AI tools are in use? And do you have data processing agreements with the AI vendors whose tools your employees use?
Companies that answer “we’re working on it” to all three are underwriting liabilities. Some insurers are declining to renew. Others are adding specific exclusions. Premiums are rising for organizations that can’t demonstrate a basic AI governance posture, and that shift is independent of whether you’ve actually had a breach.
The new exclusions appearing in cyber policy language
AI-related exclusions are showing up more frequently in 2026 policy renewals. The form varies, but the consistent pattern is an exclusion for losses arising from the use of unsanctioned or unreviewed AI tools that processed the affected data. If your breach involved shadow AI and your policy has this language, that exclusion is the mechanism that denies your claim, even if your overall policy covers ransomware and data breach events broadly.
Read your current policy. Look for language about “approved technology,” “sanctioned systems,” or “authorized third-party services.” The exclusion may already be there. SentinelOne’s May 2026 cyber insurance analysis notes that insurers have begun adding specific exclusions for shadow AI activities and related liabilities. This is a directional shift, not a universal standard yet, but the direction is clear.
What “AI usage policy” means in practice for a 200-person company
You don’t need a 40-page governance framework. A two-page policy that names approved tools, specifies data handling rules, assigns ownership, and establishes a review cadence is more defensible than a sophisticated framework that’s 14 months out of date. The bar isn’t perfection. The bar is documentation.
Insurers are not grading the quality of your AI governance program. They’re confirming it exists. A documented policy, even a simple one, communicates something the absence of any policy cannot: that someone at your company thought about this problem and acted on it.
The Compliance Landscape: What Regulations Now Require
The regulatory picture on AI governance is genuinely in motion right now, and mid-market CEOs are getting conflicting signals. Some advisors are still citing a hard compliance deadline this summer. That framing is no longer accurate.
Colorado AI Act: what the amendments and enforcement stay mean for your timeline
Colorado passed SB 24-205 in 2024. Known as the Colorado AI Act, it was one of the first state-level AI governance laws in the United States. The original law carried a compliance deadline that generated significant urgency in early 2026 advisor communications.
A federal judge stayed enforcement in April 2026. The Colorado legislature then amended the law in May 2026 with revised terms and extended effective dates. This is corroborated by law firm publications from Hunton Andrews Kurth, Norton Rose Fulbright, and Skadden, as well as Colorado legislative records. The June 30 hard deadline that circulated widely in May briefings is not current.
What hasn’t changed: the governance documentation requirements the Act was designed to address remain real compliance expectations, and other regulatory frameworks are moving in the same direction. The enforcement stay gives you more time than you had in May. It doesn’t reduce the underlying governance gap. An insurer asking for your AI governance documentation at renewal doesn’t care about the Colorado enforcement calendar.
Where other state and federal AI governance requirements stand
Colorado isn’t alone. Multiple states have advanced AI governance legislation, and federal regulatory agencies have issued guidance affecting AI use in financial services, healthcare, and consumer-facing applications. The consistent thread across all of them is documentation: written policies, impact assessments, audit trails.
The specific law that applies depends on your industry, your customers’ locations, and the nature of decisions your AI tools influence. That legal analysis belongs with your general counsel. What belongs on your desk right now is the documentation foundation: written policy, audit mechanism, vendor data processing agreements. Those are required regardless of which jurisdiction you’re reading.
The documentation floor every mid-market company needs regardless of jurisdiction
Across every regulatory framework and every current underwriting questionnaire, the documentation floor is consistent. A written AI usage policy. An inventory of AI tools in use, sanctioned and discovered. Data processing agreements with every AI vendor handling personal or sensitive data. An internal audit or monitoring mechanism, even a basic one. A policy review cadence, even annual.
That list isn’t a compliance checklist. It’s the minimum documentation set that prevents a governance argument from being the reason your claim gets denied.
Auditing Your Shadow AI Exposure: A Starting Point for Operations Leaders
You can’t govern what you haven’t found. The audit isn’t an IT project; it’s a half-day operations exercise that produces a ranked list of your actual exposure.
A shadow AI audit maps unsanctioned tool usage across operational workflows to identify data exposure points before an insurer or regulator does.
Where to look: the most common unsanctioned AI entry points in mid-market ops
Start with the workflows that carry the most pressure and the least tooling. In most mid-market operations, those are: customer-facing communications, financial reporting and data aggregation, HR processes involving personal data, document processing and summarization, and any function where the primary tool is a spreadsheet with a chronic bottleneck.
Ask each department head three questions. What AI tools is your team currently using, in any form? What types of data does your team routinely work with? If someone needed to summarize or analyze that data quickly, what would they use today? You’ll capture most of the shadow AI picture from those answers without involving IT forensics.
The IBM 2025 Cost of a Data Breach Report found that 97% of organizations that suffered an AI-related breach lacked proper AI access controls, and shadow AI was present in 20% of those incidents. The access control gap is almost always upstream of the breach. Discovering it through an internal audit costs far less than discovering it through a claim denial.
What to document: the minimum audit trail insurers require
Once you know what tools are in use, document five things for each: the tool name and vendor; the data categories processed through it; whether that processing was known and approved or discovered during the audit; whether a data processing agreement exists with the vendor; and the action taken, whether that’s continued use under new policy, discontinuation, or pending review.
That log is the artifact an adjuster will ask for. It’s not a penetration test. It’s a list showing you know what’s running in your business and have assessed the risk, which is exactly what the underwriter needs.
Blanket AI bans are the instinctive response and the wrong one. They don’t eliminate shadow AI usage. They push it further underground, to personal devices, to tools accessed outside the corporate network, to use patterns that are genuinely invisible to your security stack.
Bans drive usage underground, and underground usage is undocumented
A policy that prohibits AI tool usage without a sanction process assumes employees will choose inefficiency over productivity. They won’t. Personal devices work, consumer platform accounts are free, and data keeps moving through tools that exist in a category your policy didn’t define clearly enough.
You’ll have a ban on paper and shadow AI everywhere else. Palo Alto Networks’ cybersecurity research confirms this pattern: visibility into actual shadow AI usage declines when organizations implement broad prohibitions rather than structured governance. You lose the ability to see what’s happening, which means you lose the ability to document it.
Underground usage is also harder to defend at claims time than governed usage that followed documented policy, even imperfectly. With a ban, you’re not eliminating the risk. You’re eliminating your visibility into it.
The governance model that satisfies both employees and underwriters
Documented and structured governance is the model that works. An approved tools list. A data classification rule that tells employees which data categories can and can’t be processed through AI systems. A simple intake process for requesting approval of new tools. An employee acknowledgment record.
Employees get to use AI tools that solve real workflow problems. Underwriters get documentation that governance existed. You get a coverage position that holds under scrutiny. The COO framing: structured governance doesn’t restrict what your team can do. It replaces the current situation where your team is doing whatever they want and you’re carrying the insurance exposure for all of it.
The governance model handles the risk. Custom internal tooling removes the root cause. The distinction matters for how durable your solution actually is.
When employees use a consumer AI tool to summarize contracts because your internal systems don’t have that capability, the governance model patches the exposure. A custom internal tool that does contract summarization, built on a governed AI infrastructure, processing data within your environment, generating an audit trail by design, removes the exposure entirely.
The difference is architectural. Consumer AI tools process your data on someone else’s infrastructure under someone else’s data handling terms. Custom internal tools process your data in your environment under your terms, with operations logged, data access attributable, and every AI output traceable. “Auditable” means something specific to an underwriter: not that you watched your employees use the tool, but that the tool itself generates the audit trail.
Purpose-built internal software replacing manual workflows
What governance documentation looks like when AI is built into the workflow by design
When AI capability is built into an internal tool rather than accessed through a consumer platform, governance documentation emerges from the development process itself. Architecture documentation describes what data flows where. System design records capture what AI infrastructure is used and under what contractual terms. Access control records show who can use the tool and for what data categories.
None of that requires a separate compliance exercise. It’s a byproduct of building the tool correctly. The insurer’s documentation checklist is already satisfied before you file the renewal.
The operational case: solving the workflow problem that created shadow AI in the first place
Take the finance coordinator who needed to summarize 40 vendor contracts. Or the operations team extracting data from supplier PDFs. Or support trying to draft customer responses faster than the CRM’s template system allowed. Consumer AI tools solved all of those problems, outside your governance perimeter.
Custom internal tooling solves the same problems, with your data policies, your access controls, your audit trail, and your security architecture. The shadow AI risk disappears not because you banned the behavior, but because the behavior no longer needs to happen outside a governed system.
The COO gets the efficiency. The CEO gets the coverage position. One tool delivers both.
Purpose-built internal AI tools route data through governed, auditable infrastructure, generating the documentation trail that insurance underwriters require and consumer AI tools cannot provide.
What Your Insurer Wants to See Before Your Next Renewal
This section is for your general counsel, your COO, or whoever owns your insurance renewal process. These are the artifacts that underwriters ask for and claims adjusters require.
The AI governance documentation checklist
Before your next renewal, you should be able to produce:
- AI tool inventory: A list of all AI tools in use, including the date each was approved, the approving authority, and the data categories each tool is permitted to process. Include tools discovered during your shadow AI audit with their current status.
- Data classification policy: A written policy categorizing your data types (personal data, financial records, client data, proprietary information) and specifying which categories can be processed by AI tools and under what conditions.
- Employee training record: Documentation that employees were informed of the AI usage policy, including the date of training and acknowledgment records.
- Vendor data handling review: For each approved AI tool or platform, a record that you reviewed the vendor’s data processing terms and made a documented decision about acceptability.
- Incident response update: A version of your existing incident response plan that addresses AI-related data exposure scenarios, not just traditional breach scenarios.
- Named accountability: A role or individual designated as responsible for AI governance. This doesn’t require a new hire. It requires a name in a document.
How to communicate your AI posture to underwriters
Lead with what you’ve done, not what you intend to do. Underwriters’ weight completed controls significantly higher than planned controls. When your broker submits the renewal application, a one-page summary of your AI governance program (approved tools, data classification framework, audit mechanism, review cadence) submitted proactively signals that you’ve addressed the risk intentionally.
“We conducted a shadow AI audit in [month] that identified [N] unsanctioned tools. We discontinued [N], approved [N] under new data handling terms, and implemented an employee training process documented in the attached log.” That narrative, with artifacts attached, positions you as a company that identified and addressed a risk category. That’s the security posture cyber insurance is designed to reward.
Ready to replace unsanctioned AI tools with governed internal software built around your actual workflows? Talk to Nexa Devs about building coverage-safe AI tooling. We build auditable internal tools that solve the workflow problems that created shadow AI in the first place.
FAQ
Is AI covered under cyber insurance?
AI use itself isn’t excluded from most cyber policies, but breaches caused by unsanctioned AI tools can be. If an employee routes sensitive data through a consumer AI platform without documented governance, the insurer may deny coverage, citing failure to maintain reasonable security controls. The risk isn’t AI use. It’s undocumented AI use.
What are the most common reasons cyber insurance claims are denied?
Claims are most commonly denied for absent security controls, failure to document preventative measures, delayed breach notification, and third-party data processor oversight failures. In 2026, missing AI governance documentation has emerged as a newer denial basis as insurers update underwriting criteria and adjust breach investigations.
Does shadow AI affect cyber insurance coverage?
Yes. Shadow AI creates undocumented data exposure that insurers treat as a security control failure. When a breach reveals that employees used consumer AI tools without governance documentation, insurers have grounds to deny claims under existing exclusions. The documentation gap is the direct denial mechanism.
What controls improve underwritability for AI risks?
Underwriters look for an approved AI tool inventory, a data classification policy applied to AI use cases, employee training records, vendor data handling reviews, and a named governance role. These don’t require a compliance team. A completed documentation package signals that your security posture is active and managed.
How does shadow AI impact compliance in regulated industries?
In financial services, healthcare, and education, shadow AI creates dual exposure: insurance denial risk and regulatory violation risk. Data processed through consumer AI tools without governance can trigger breach notification obligations and compliance failures. The documentation requirements for cyber insurance renewals substantially overlap with regulatory documentation requirements.
What is the difference between shadow IT and shadow AI?
Shadow IT is any technology used without IT approval. Shadow AI is a faster-moving version: AI tools accessed through a browser with no installation, no network traffic to monitor, and no license purchase to flag. An employee can route sensitive data through a consumer AI platform on a personal device with no corporate system seeing it, making shadow AI a distinct insurance risk category.
by Sarah Mitchell | Jul 2, 2026 | Uncategorized
AI-Assisted Technical Documentation for Black-Box Systems
You have a system running your business that nobody fully understands. It processes orders, handles billing, manages the data your operations depend on every day. And somewhere in your organization, maybe in one person’s head, maybe nowhere at all, lives the knowledge of how it actually works.
AI-assisted technical documentation is the process of using AI analysis tools alongside human engineering judgment to reconstruct that knowledge. It maps dependencies, infers business logic from code behavior, and produces usable documentation from systems that have none. For mid-market companies running undocumented legacy platforms, it’s the difference between a system you own and a system that owns you.
The System Nobody Dares Touch
You know the one. Touching it makes everyone nervous. Changes go through one specific person because everyone else is afraid of what they might break. The system works. Until it doesn’t.
That’s the defining characteristic of a black-box legacy system: operational dependency without operational understanding. The business relies on it. Nobody can safely modify it. And the knowledge of how it functions lives in exactly one or two places, neither of which is a document.
A developer stares at an undocumented legacy codebase, the kind of system AI-assisted technical documentation is designed to decode.
When the only person who understood it left
Martin Fowler’s team documented a real case: a legacy system with 650 database tables, 1,200 stored procedures, roughly 350 user screens, and 45 compiled DLLs. Zero surviving documentation. The company had to issue a formal RFP for a six-month discovery and reconstruction effort just to understand what they owned.
This isn’t a rare edge case. A GenericDE consultant describes a client who discovered their core software was maintained by an 82-year-old retired developer, working part-time from retirement, because he was the only person who still understood it. The CEO learned this during a system crisis.
The bus factor in these situations isn’t low. It’s one. And when that person gives notice, or has a health event, or simply stops picking up calls, the organization discovers how fragile its operational foundation really is.
Why mid-market companies are disproportionately exposed
Enterprise organizations have IT departments, architecture review boards, and documentation standards written into vendor contracts. They still accumulate black-box systems, but they have more layers of protection when something breaks.
Mid-market companies built their systems under different conditions: limited budget, a small developer team (sometimes a team of one), and pressure to ship features rather than write documentation. What started as pragmatic technical debt compounds over years into a system nobody dares touch.
A SpeakWise 2024 knowledge management study puts it starkly: 62% of organizations identify poor knowledge-sharing as a direct cause of project failures. For a 200-person company where the operations manager, the billing system, and the customer portal all depend on the same undocumented codebase, that failure rate isn’t abstract. It’s a live operational risk every sprint cycle.
Legacy systems AI integration
What “Undocumented” Actually Costs You
{#what-undocumented-actually-costs-you}
The cost of an undocumented system isn’t what you pay to recover it. It’s what you lose every week while it stays that way.
Every new developer you hire needs three to six months before they can safely touch the system. Every bug fix takes longer because the engineer has to reverse-engineer behavior before they can understand what changed. Every vendor conversation starts with a caveat: “We’d need a discovery phase first.”
The compounding cost of undocumented legacy systems: slower feature delivery, expensive onboarding, and frozen vendor transitions.
The hidden tax on every new hire and vendor onboarding
Knowledge workers spend approximately 2.5 hours per day on information retrieval activities, searching for answers that should already be documented. SpeakWise’s 2024 analysis, which likely traces to IDC research, puts that figure at roughly 30% of the workday. Applied to engineering teams working on undocumented systems, that 30% isn’t general information retrieval. It’s engineers re-discovering behavior that was known once and written down nowhere.
The onboarding math is blunt. A new developer joining a team with clean, current documentation gets productive in weeks. A developer joining a team with a black-box system spends their first three months learning, mostly by reading code, watching what breaks, and asking the one person who knows. If that person is busy, or unavailable, or gone, the onboarding timeline stretches further.
Vendors face the same friction. A new development team hired to maintain or extend an undocumented system will tell you upfront: “We need a discovery phase.” That phrase, in practice, means two to four weeks of your engineers’ time, plus the new vendor’s time, plus a significant chunk of budget before a single feature gets built. Multiply that by every vendor transition and every new developer hire over five years, and the cost of not having documentation becomes concrete.
What happens when the system becomes a compliance or audit liability
In regulated industries (healthcare, financial services, insurance), undocumented systems don’t just slow down onboarding. They create audit exposure.
An auditor asks: “Show me how this system processes this transaction.” Without documentation, the answer is: “We’ll have to trace through the code.” That answer works once, with a generous auditor, in a low-stakes context. It fails in due diligence. It fails in compliance reviews. It fails in M&A, where an acquiring company’s technical team will walk away from a deal, or demand a significant price reduction, when system documentation doesn’t exist.
The compliance case for documentation isn’t about regulatory perfectionism. It’s about whether your system is acquirable, auditable, and defensible when scrutiny arrives.
Why Traditional Documentation Methods Break Down on Black-Box Systems
The most common approach to documenting a legacy system is to assign it to the development team as a sprint task. Put it on the backlog. Document when there’s time.
There is never time.
This isn’t a discipline failure. It’s a structural problem. Documentation competes with feature delivery, and feature delivery wins every sprint, every quarter, every year. The documentation backlog grows while the system evolves. Eventually the system is so far ahead of any documentation attempt that starting feels impossible.
The documentation sprint that never gets done
Even when organizations allocate dedicated time for documentation, the effort stalls. The developer assigned to document a system they didn’t build spends most of their time reading code they don’t fully understand, making inferences, and being uncertain about whether those inferences are right. Without the original developer in the room, every hour of documentation produces output that might be wrong.
Wrong documentation is often worse than no documentation. A new developer who reads a spec that incorrectly describes system behavior will build toward the spec, break the system, and spend days debugging before realizing the documentation was the problem.
Institutional knowledge loss in software development
When tribal knowledge walks out the door
The one person who understands the system isn’t just a knowledge holder. They’re a single point of failure. When they leave (and at some point, they will), their knowledge doesn’t transfer. It evaporates.
Replacing senior technical talent costs between 150% and 400% of annual salary, and projects face delays of six to twelve months after departure, according to ClearlyAcquired’s 2026 research. Those numbers assume the departing person left documentation behind. When there’s no documentation, the delay isn’t six months. It’s as long as it takes to rebuild the knowledge from scratch, which can take longer than the original system took to build.
Traditional documentation methods don’t solve this problem. They assume time, they assume the original developers are available, and they assume the documentation will stay current as the system evolves. None of those assumptions hold for most mid-market legacy systems. The methods fail because the conditions they require don’t exist.
How AI Reconstructs What Was Never Written Down
{#how-ai-reconstructs-what-was-never-written-down}
AI code analysis tools approach undocumented systems as a reverse-engineering problem, not a documentation task. They don’t ask “what should this do?” They ask “what does this actually do?” And they infer the answer from the code itself.
That distinction matters. Traditional documentation starts from intent. AI-assisted technical documentation starts from behavior. What comes out is grounded in what the system actually does, not what someone remembers about what it was supposed to do.
AI code analysis maps dependency chains, data flows, and business logic in undocumented legacy codebases, the foundation of AI-assisted technical documentation.
Dependency mapping and data flow inference
The first thing AI tools do well is map what connects to what. A codebase with 650 tables and 1,200 stored procedures looks unnavigable to a human reading files sequentially. An AI tool scans the entire codebase simultaneously, identifies call chains, traces data flow between modules, and produces a dependency graph that no human could build manually in the same timeframe.
That dependency graph is the foundation. It tells you which parts of the system are tightly coupled (change one thing, three others break), which modules are isolated (safer to modify), and which components haven’t been touched in years (potential dead code vs. rarely-used-but-critical paths). None of that structure was documented. Code analysis surfaces all of it.
Dependencies tell you what the system connects. Business logic tells you what it decides.
AI tools analyze conditional logic, exception handling, and edge-case branches to identify what the system is doing and why. A billing module that adjusts pricing under specific customer account conditions contains business rules that were probably agreed in a meeting five years ago, implemented by a developer who has since left, and never written into any specification document. The rules are in the code. AI analysis surfaces them.
Results aren’t always clean. Inferred business logic sometimes reflects bugs rather than intent, accumulated workarounds for edge cases the original developer never fully resolved. Human engineers have to distinguish between “this is how the business works” and “this is a patch that was never cleaned up.” AI accelerates the discovery; humans make the judgment calls.
Building the spec from outputs and edge cases
The third layer is behavioral documentation: what does the system produce under what conditions? AI tools can generate test coverage maps from existing code, identify untested branches, and flag areas where the system’s behavior under edge cases is unknown.
That behavioral output becomes the foundation of a working specification. Not a spec written from memory, but one derived from observed behavior. For teams preparing to hand off a system to a new vendor (or to onboard a new developer), this behavioral spec is often more valuable than any intent-based document would have been.
“As David Burg, Cybersecurity Leader at Ernst & Young Americas, states: ‘The documentation of architecture, interoperability, and dependencies was likely never documented. When they were built, developers were working with the institutional knowledge that existed at that time.'” The AI-assisted approach closes this gap retroactively, recovering the context that should have been captured during development but wasn’t.
Where AI Hits Its Limits (And Where Humans Have to Take Over)
AI tools accelerate documentation recovery. They don’t complete it. The two hard limits (context window constraints and hallucination risk) aren’t quirks to work around. They’re places where human engineering judgment can’t be substituted.
Context window constraints on large codebases
Most AI code analysis tools process code in chunks. A 650-table database with 1,200 stored procedures and a decade of accumulated business logic won’t fit in a single context window. The tool sees a section of the codebase at a time, infers relationships within that section, and produces output that may be accurate locally but miss cross-system dependencies that span sections.
In practice, large codebases require scoped passes. Engineers must guide the AI through the system in logical segments, aggregate the per-segment findings, and synthesize a whole-system view manually. That’s architecture work. It requires someone who understands software systems to decide how to segment the analysis, what to look for in each pass, and how to reconcile conflicting inferences across passes.
The AI does the heavy lifting on code reading. The human does the architecture work. Neither replaces the other.
The hallucination problem in undocumented systems
AI language models infer. When code is ambiguous, when a variable name is meaningless, when a stored procedure does three things that seem unrelated, when an exception handler catches every error and logs nothing, the AI will produce an explanation. Sometimes that explanation is accurate. Sometimes it’s a plausible-sounding reconstruction that doesn’t match what the code actually does.
In a documented system, hallucinations are easy to catch: the output contradicts the spec. In an undocumented system, there’s no spec to check against. The only verification mechanism is a human engineer reading the AI’s output, tracing the relevant code, and confirming whether the inference is correct.
Validation can’t be skipped. Teams that treat AI-generated documentation as immediately trustworthy will publish specs that contain errors, onboard developers against those errors, and spend months debugging systems they thought they understood. That verification step is the cost of accuracy, and there’s no way around it.
AI readiness assessment guide
The Documentation Sprint: A 30-Day Playbook for Mid-Market Teams
{#the-documentation-sprint-a-30-day-playbook-for-mid-market-teams}
A 30-day documentation sprint is enough time for a mid-market team to move from no documentation to a usable system blueprint, if the sprint is structured correctly. Here’s what that looks like in practice.
The four-week documentation sprint: from system discovery and scope triage through AI extraction, human validation, and final output formats.
Week 1: System discovery and scope triage
The first week isn’t about AI tools. It’s about figuring out what you actually have.
The goal is a system inventory: every database, every service, every external integration, every place data enters and leaves the system. This requires access to the production environment, access to the code repository, and at least one person who has worked with the system recently enough to know what the components are called.
From the inventory, the team does scope triage: which parts of the system are business-critical and opaque (high priority for documentation), which parts are well-understood even without formal docs (lower priority), and which parts appear dormant (flag for verification before investing documentation effort there).
Week 1 produces three things: a system inventory, a priority map, and an explicit decision about what the sprint will document. Without this scoping work, the AI-assisted extraction in Weeks 2 and 3 has no north star. The team documents everything and finishes with a mass of output nobody knows how to use.
Weeks 2 and 3: AI-assisted extraction and human validation
Weeks 2 and 3 are where the actual recovery happens. AI tools run against the scoped codebase: dependency analysis, business logic extraction, data flow mapping, behavioral documentation.
The output from each AI pass goes immediately to a human reviewer, an engineer with enough architectural experience to distinguish accurate inferences from plausible-but-wrong ones. Every flag, every uncertain inference, every “this might be doing X” output gets marked for validation against the actual code.
The ratio that works in practice: AI produces a draft, human reviews for accuracy, AI refines with corrections, human approves. This loop takes more time than some teams expect. Budget 60% of the two weeks for AI extraction and 40% for human validation. Teams that underestimate the validation load hit week 3 with a large backlog of unverified AI output, which defeats the purpose of the sprint.
Documentation that doesn’t get used isn’t documentation. It’s a file.
The final week converts the validated extraction output into formats that serve the system’s next users. What those formats are depends on who uses them:
- A new development team joining for ongoing maintenance needs a system architecture overview, a module guide, and a data dictionary.
- A compliance auditor needs transaction flow documentation and a record of how data is processed.
- A developer onboarding to make specific changes needs component-level specs for the modules they’ll work in, not a full-system overview.
One documentation sprint, three different output formats, each shaped for the person who’ll use it. That shaping work is what turns extracted knowledge into something useful. Skip it,its and you have 30 days of AI output sitting in a folder nobody opens.
From Documentation to Handoff: Setting Up the Next Team for Success
Recovered documentation isn’t the end state. It’s the prerequisite for everything the business needs to do next: transition to a new vendor, bring in a new developer, respond to an audit, or modernize the system into something that can handle AI integration.
What a new vendor needs before day one
A development team that inherits an undocumented system will spend their first weeks in discovery: reading code, asking questions, building context. That discovery period doesn’t produce features. It produces understanding, which the team then uses to produce features.
Give a new vendor a system blueprint, an architecture overview, and a behavioral spec on day one, and their ramp time compresses. Instead of three weeks of discovery before first sprint, they’re contributing in sprint one. You’re paying a development team to build, not to learn.
The teams at Nexa Devs see this gap consistently. Mid-market companies that come in with documented systems move faster from the start. A system blueprint handed off on day one isn’t just a formality. Every team that follows benefits from it.
Outsourcing software development documentation
Making documentation a living artifact, not a one-time project
A documentation sprint recovers what was lost. It doesn’t prevent future loss.
The structural problem with most legacy documentation efforts is that they happen once, produce a static output, and immediately begin to decay as the system evolves. Six months after the sprint, the system has changed and the documentation hasn’t. Twelve months in, the docs are already misleading. Two years later, you’re back where you started.
The fix is architectural: documentation maintained alongside code, not written after the fact. Architecture Decision Records (ADRs) capture why decisions were made, not just what was decided. AI-assisted documentation tools integrated into the development workflow generate and update specs as code changes. The sprint produces the foundation; the process keeps it current.
Nearly 55% of mid-sized companies plan to adopt knowledge management systems within the next 24 months, according to SpeakWise’s 2024 data. The companies that treat that investment as a continuous engineering practice, not a one-time project, are the ones that stop accumulating new black-box systems while they’re recovering from old ones.
The goal isn’t just documentation. It’s system ownership. When you understand how your system works, when that knowledge is captured and current, and when a new team can onboard in days rather than months, the system works for you. Not the other way around.
Ready to Recover What Was Never Written Down?
If you’re running a system that nobody fully understands, the risk isn’t in the future. It’s live right now, in every hire who takes months to ramp, every vendor conversation that starts with “we’d need a discovery phase,” every audit question you answer with uncertainty.
Book a system documentation assessment
A 30-day documentation sprint starts with a scoping conversation. Talk to the Nexa Devs team about what your system looks like and how long it would take to recover its documentation.
FAQ
How do you integrate AI into legacy systems without disrupting existing operations?
AI documentation tools analyze your codebase without modifying it. They read, they don’t write. The integration risk is near zero. Documentation recovery happens in a parallel environment, not in production. Changes to the live system only follow after documentation confirms what’s safe to touch.
Can AI rewrite or modernize legacy code automatically?
Not reliably, and not without significant human oversight. AI tools can suggest refactored code and flag candidates for modernization, but automatic rewrites on production systems carry serious risk. Documentation recovery (understanding what the system does before changing it) is the necessary first step before any modernization work begins.
Why do legacy systems become undocumented in the first place?
Documentation is always a lower priority than shipping. Teams under pressure to deliver features consistently defer documentation, and it never catches up. Over years, as developers leave and systems evolve, the gap between what exists and what’s written down compounds until the system is effectively a black box.
What is the business risk of running a system only one person understands?
Single-point-of-failure knowledge is an operational risk most mid-market CEOs underestimate until it triggers. When that person leaves, everything requiring system changes stops or slows dramatically. ClearlyAcquired’s 2026 research puts replacement cost for senior technical talent at 150% to 400% of salary, with six to twelve months of project delays.
Is AI documentation of legacy code accurate enough to trust for production changes?
Not directly. AI-generated documentation requires human validation before any production team uses it as a basis for changes. The documentation sprint model exists precisely for this reason: AI produces the draft, engineers verify the inferences, and only validated documentation enters the system record.