
Table of Contents
Technical Debt ROI: A CEO’s Calculation Framework
Your IT team calls it technical debt. Your CFO doesn’t see it anywhere. That’s the problem.
The cost is real, it’s enormous, and it’s already inside your budget, hidden inside delivery estimates, recruiting premiums, and projects that were supposed to take two weeks but took twelve. The ROI of paying it down isn’t a theoretical IT calculation. It’s a P&L argument you can take to your board right now, built on four cost categories and a payback period your CFO will recognize.
This framework walks you through exactly that calculation.
The Silent Tax Your CFO Doesn’t See on Any Balance Sheet
Technical debt doesn’t show up in your financial reporting. That’s what makes it dangerous. It’s a cost your organization absorbs every single quarter without a line item to point at.
Why technical debt never appears in standard financial reporting
Standard financial reports capture what you spend, not what you’re prevented from earning. Technical debt operates entirely in the second category. Every sprint takes three weeks instead of one because the codebase is fragile — that’s a cost. Every senior engineer who declines your offer because they won’t work in a decade-old stack — that’s a cost. Every product feature you couldn’t ship while a competitor did — that’s revenue you didn’t book.
None of these appear as a debit on any standard balance sheet. They appear as a pattern of “slower than expected,” “harder than it should be,” and “we’ll get to that next quarter.”
As Ray Forte, an executive at Analog Devices, put it after auditing their own IT portfolio: “The first thing we did was calculate what percentage of our investment would be needed to keep the lights on. It was in the low 80s.”
He didn’t need a technical audit to find the problem. He found it in the budget.
Where the costs actually hide: delivery estimates, recruiting premiums, and deferred revenue
Three specific places absorb technical debt cost without labeling it:
- Delivery estimates. Teams working in legacy codebases routinely quote 3–5x the time to deliver compared to teams working in clean architectures. That multiplier is technical debt expressed as opportunity cost.
- Recruiting premiums. Senior engineers won’t join companies running end-of-life stacks without meaningful extra compensation — or they won’t join at all. The premium you pay to attract talent to a legacy environment is a hidden maintenance cost.
- Deferred revenue. When a competitor ships a feature in two weeks, and your team needs twelve, the revenue gap between those timelines belongs on your technical debt ledger. It won’t be there, but it should be.
According to Deloitte’s 2026 Global Technology Leadership Study, technical debt accounts for 21% to 40% of an organization’s IT spending, with nearly 60% of surveyed leaders believing an additional 21–50% of enterprise value remains trapped due to technical debt’s effects.
That’s not an engineering estimate. That’s senior technology leaders describing the opportunity cost in financial terms.
Read: “Technical debt cost.”
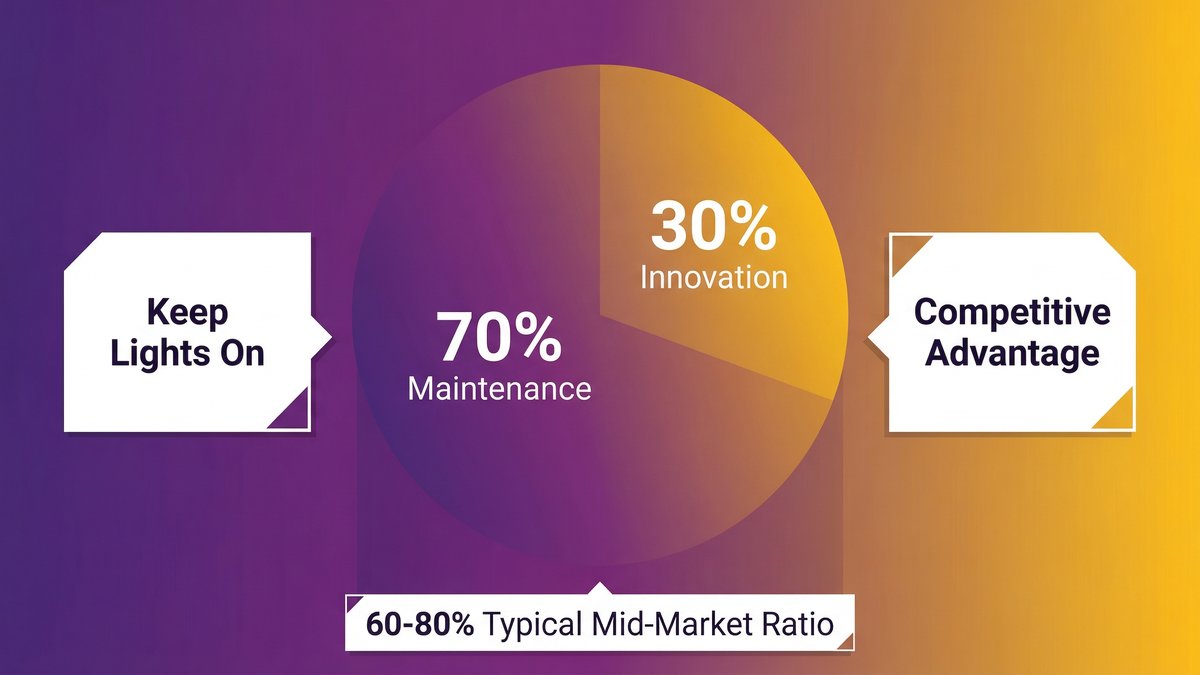
What 60–80% of Your IT Budget Is Actually Buying
This is the number that reframes the whole conversation. According to Profound Logic (citing Mechanical Orchard research), organizations spend between 60–80% of their IT budgets on maintaining existing systems, leaving only 20–40% for innovation and growth initiatives.
Read that again. At 70% maintenance spend — the midpoint — roughly $0.70 of every dollar you invest in technology buys you zero competitive advantage. It keeps the current system from falling over.
The maintenance-to-innovation ratio: what the research shows
The 60–80% figure isn’t an outlier. It’s consistent across independent research. CIO Dive reports IT leaders spend an average 72% of their budgets on keep-the-lights-on functions. McKinsey finds that CIOs estimate that 10–20% of their technology budget dedicated to new products is diverted to resolving technical debt. William Flaiz, a digital transformation leader who ran technology at Novartis, described it this way: “60% of our IT budget was consumed by maintaining systems that supported less than 15% of business value. The math was undeniable: consolidation wasn’t just a smart strategy, it was financial survival.”
These aren’t edge cases. They describe the standard operating condition for a mid-market organization running systems built for an earlier version of the business.
Translating the ratio into a real dollar opportunity cost
Take your annual IT budget. Multiply it by 0.70. That number is what you’re spending on maintenance today.
Now imagine redirecting 20 percentage points of that — one dollar in seven — toward new capability instead. What’s the revenue value of the features you couldn’t ship last year? What’s the cost of the AI initiative that stalled because your data architecture couldn’t support it?
That’s not the cost of technical debt remediation. That’s the opportunity cost you’re currently absorbing. The argument to your CFO isn’t “we need to spend more on modernization.” It’s “we’re already spending the modernization budget — we’re just not getting the modernized system.”
How to Calculate What Technical Debt Is Costing Your Organization
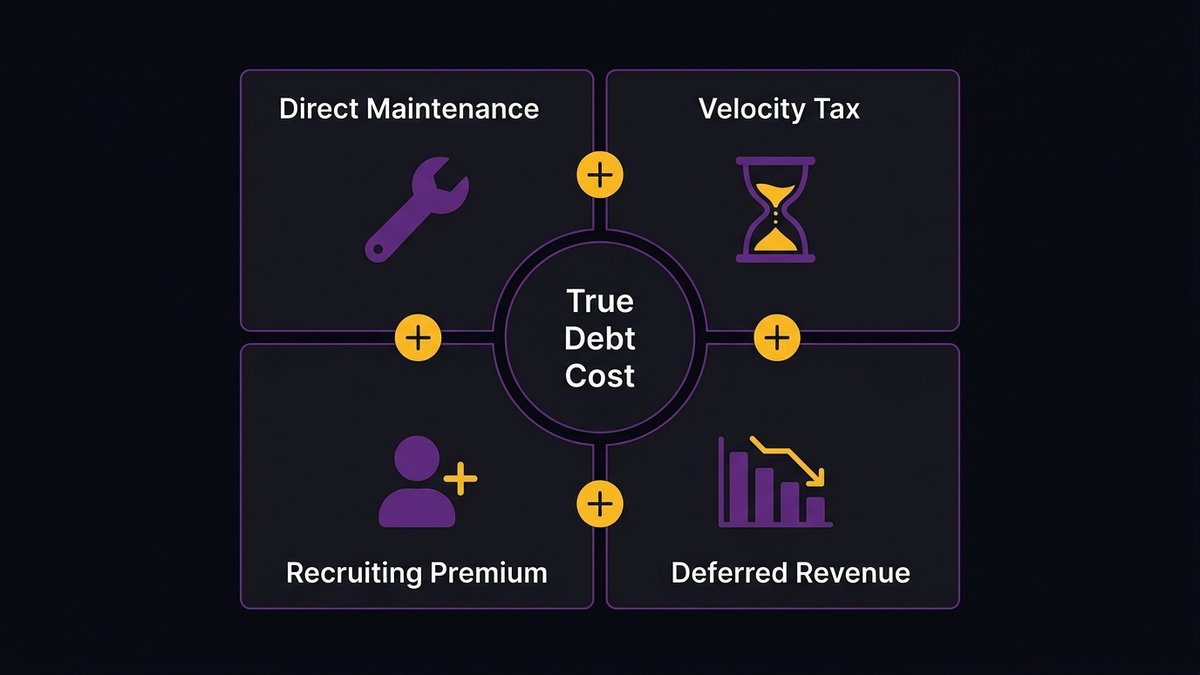
The full cost of technical debt in a mid-market organization sits across four distinct categories. Most organizations only count the first. The CEOs who make the board case successfully count all four.
The four cost categories: direct maintenance, velocity tax, recruiting premium, and deferred revenue
1. Direct maintenance cost
This is what your team reports directly: time spent on bug fixes, system patches, security updates, and infrastructure upkeep on legacy code. It’s the most visible category and consistently the most underestimated, because teams rarely track maintenance hours separately from product development hours.
2. Velocity tax
Legacy codebases impose a multiplier on every development task. Features that take two days in a clean, modern system take ten days in a fragile legacy codebase with poor documentation and tight coupling across components. That difference — the “velocity tax” — accumulates over every sprint, every quarter, every year.
3. Recruiting premium
Attracting senior engineers to work on outdated stacks costs a measurable premium in compensation. Some candidates decline entirely. The cost of extended recruiting cycles, higher compensation offers, and above-market contractor rates to compensate for the environment all belong in the technical debt ledger.
4. Deferred revenue
This is the hardest category to quantify and the most strategically significant. Every product feature your team couldn’t ship on time because of legacy system constraints represents revenue you didn’t book. Every AI initiative that couldn’t move past pilot stage because your data architecture blocked it represents a future revenue stream you don’t yet have access to.
A simple CEO calculation framework: from IT spend to true annual cost
Run this calculation before your next board meeting:
- Annual IT budget = $X
- Maintenance ratio (use 65% as a conservative mid-market estimate if you don’t have your own number): $X × 0.65 = Direct maintenance proxy
- Velocity tax (conservative estimate: add 30% to your delivery estimates as the time your team spends navigating legacy complexity rather than building): Development salary cost × 0.30
- Recruiting premium (if you’ve had open engineering roles for more than 60 days, add $15,000–$25,000 per unfilled role per quarter)
- Deferred revenue (identify one product initiative delayed by technical debt in the last 12 months; estimate the revenue it would have generated in its delayed period)
Add categories 1–4. That’s a real number. Not an engineering metric. A business cost.
As Cesar DOnofrio, CEO and co-founder of Making Sense, a digital transformation firm, describes it: “We see the ROI floor drop out when organizations spend 80% of their budget on bespoke middleware just to get fragmented systems to talk to each other. At that point, you aren’t investing in intelligence; you are paying a legacy tax to keep the lights on.”
The Business Evidence: What Happens When Organizations Let Debt Compound
Three cases. Each one shows a different dimension of what happens when technical debt isn’t treated as a business risk.
Knight Capital Group: $440M in 45 minutes
In August 2012, Knight Capital Group deployed a software update to its trading system. A piece of legacy code — dormant for years — got inadvertently reactivated during the deployment. In 45 minutes, the system executed $7 billion in unintended trades. The loss: $440 million. The company was sold within months.
The business failure wasn’t caused by bad strategy or market conditions. It was caused by undocumented legacy code that no one fully understood, in a system that had accumulated technical debt over a decade of patched deployments. One release, one forgotten flag, $440 million.
Southwest Airlines: $600M+ in operational debt made visible
In December 2022, Southwest Airlines canceled over 16,000 flights during a weather event that other airlines recovered from in days. Southwest’s crew scheduling system — built in the 1990s — couldn’t handle the rerouting at scale. The system’s logic for crew assignments couldn’t process the cascading changes fast enough to recover.
The result: $800 million in total costs, $140 million in compensation to passengers, a Department of Transportation investigation, and a CEO who spent months explaining the failure to Congress. None of the operational analyses pointed to bad weather as the root cause. It pointed to a system that hadn’t been modernized to handle the operational complexity the airline had grown into.
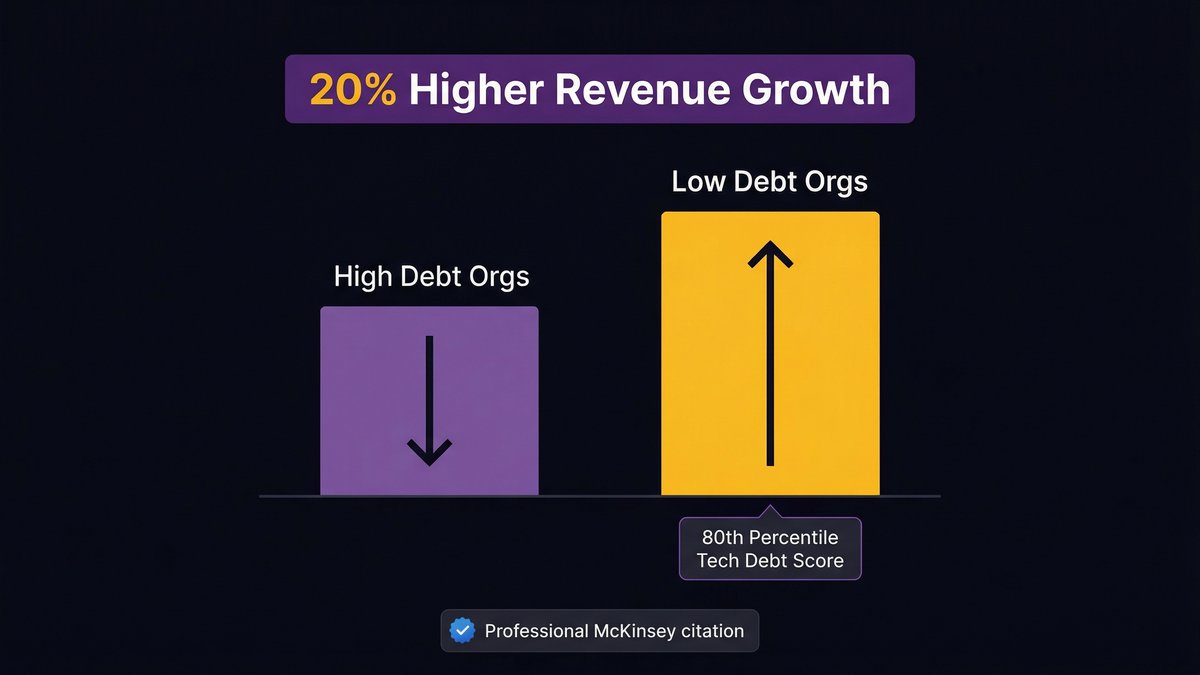
The McKinsey finding: 20% higher revenue growth for low-debt organizations
McKinsey’s analysis of 220 companies found that those in the 80th percentile for Tech Debt Score achieve 20% higher revenue growth than those in the bottom 20th percentile. This isn’t a correlation between “good companies manage debt better” — it’s a direct causal mechanism. Low-debt organizations ship features faster, integrate new capabilities more readily, and don’t have development capacity consumed by maintenance backlogs.
The revenue difference is the compounded velocity advantage over time. Every quarter a low-debt team ships two features while a high-debt team ships one is a quarter where the product gap widens.
Why Full Rewrites Fail — and What the ROI Data Says About the Alternative
Most CEOs who have tried to address technical debt have tried it the wrong way. They approved a full rewrite. It ran over budget, over time, and delivered a system that introduced new problems rather than solving the old ones. That failure is not random — it’s structural.
Rewrite risk: why “start over” projects run 36–48 months to positive ROI
Full rewrites fail for three predictable reasons:
First, they require two systems to run in parallel — the old system stays live while the new one is built, doubling operating cost and engineering complexity during the transition period.
Second, business requirements don’t freeze while the rewrite runs. By the time a 24-month rewrite completes, the requirements it was built against are 24 months out of date. Teams spend the last third of the project retrofitting a system they built against the wrong spec.
Third, the institutional knowledge embedded in the old system never fully transfers to the new one. Edge cases, undocumented business rules, and operational quirks that the old system handled correctly get missed. The new system breaks in production in ways the old system never did, because the old system had accumulated decades of patches specifically for those edge cases.
The result: a full rewrite with a 36–48 month path to positive ROI that frequently misses even that timeline.
“I have seen this approach fail at other companies,” one senior technology leader described in an engineering leadership forum, “where a 2-year project turns into a 4-year project, and they are stuck at 70% migrated for months while new requirements roll in.”
That’s not an edge case. It’s the standard failure mode.
Incremental AI-augmented modernization: how the payback period drops to 12–14 months
The alternative isn’t “do nothing” versus “start over.” It’s incremental modernization — replacing the highest-cost, highest-risk components first, in production, without stopping the business.
According to UpdateCode.ai (2026), citing IBM and AWS research, legacy software modernization results in a 74% reduction in IT costs (IBM), a 66% reduction in infrastructure costs (AWS), and 43% faster time-to-market. Incremental AI-powered modernization delivers positive ROI in 12–14 months, compared with 36–48 months for traditional rewrite approaches.
The mechanism is different from a full rewrite. Incremental modernization:
– Reduces maintenance costs in the modernized components immediately, without waiting for a full system replacement
– Keeps the existing system live and revenue-generating throughout the process
– Uses AI-augmented development tooling to accelerate the work — analyzing the legacy codebase, generating migration plans, writing and testing replacement components with significantly less manual effort
– Produces documented, owned components at each phase rather than waiting for a three-year completion to transfer any knowledge
The payback math changes because the cost reduction starts in month one, not month 36.
The Compounding Return: How Modernization Unlocks AI Readiness
Here’s the dimension most financial models miss. The ROI of technical debt remediation isn’t just cost reduction. It’s the unlocking of revenue layers that your current architecture makes completely inaccessible.
Why legacy systems block AI integration at the architectural level
AI systems — whether predictive models, intelligent automation, or agentic workflows — have specific infrastructure requirements. They need real-time or near-real-time data access. They need API-first interfaces that can receive and return structured requests. They need modular, loosely coupled architectures so that an AI component can integrate without requiring a full system rebuild around it.
Legacy systems fail all three requirements by design. They were built for a different integration model — batch processing, file transfers, tightly coupled modules that assume the only thing interacting with the system is a human sitting at a screen.
According to IBM’s Institute for Business Value (November 2025), technical debt can cut AI ROI by 18% to 29% if ignored — even in high-potential projects. Organizations that factor in remediation costs when building AI use cases project ROI that is 29% higher than those that don’t.
So the choice isn’t just “pay for modernization or don’t.” It’s “pay for modernization and access AI revenue, or skip modernization and watch 18–29% of your AI investment evaporate.”
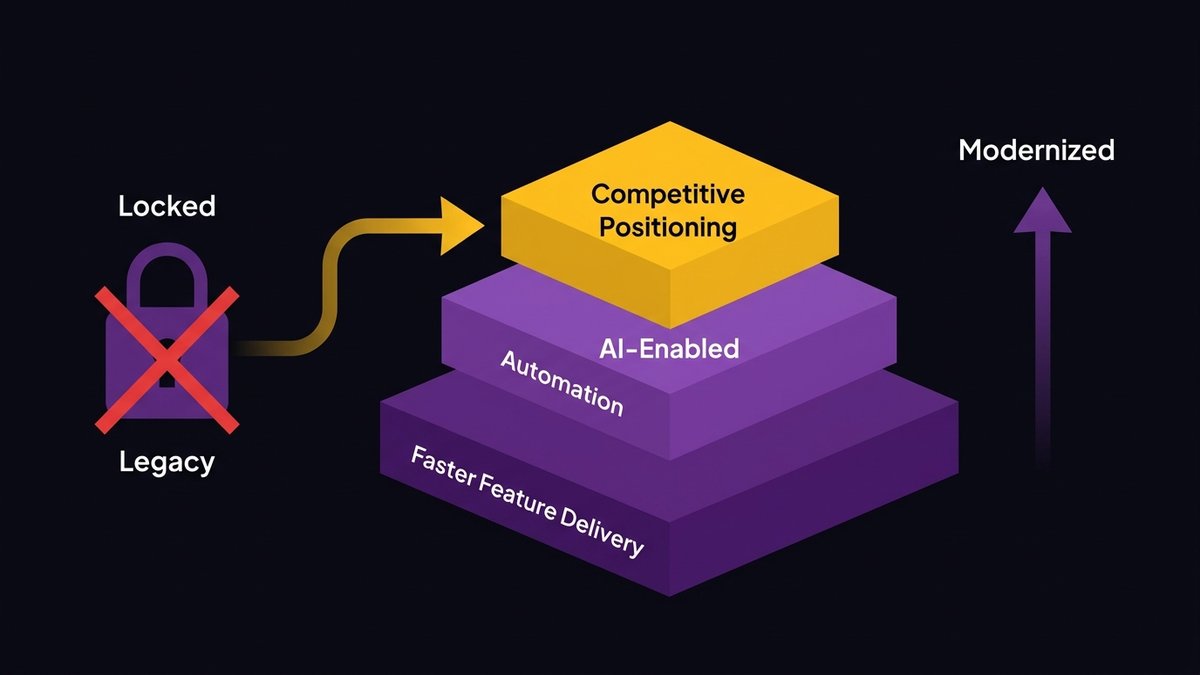
The additional revenue layers that only modernized systems can access
Three specific revenue categories open up when a legacy system gets modernized:
Faster feature delivery. Clean, documented, modular codebases ship features in days that legacy systems ship in weeks. That velocity difference compounds quarterly. A team that ships 40 features per year versus 15 builds a meaningfully different product.
AI-enabled automation. Workflow automation, intelligent data processing, and natural language interfaces all become available as implementation options once the architecture can support them. These aren’t speculative future benefits — they’re active capabilities competitors are deploying right now against customers who still share an operations stack with a system built in 2008.
Competitive positioning. As Skylar Roebuck, CTO of Solvd, an AI-first advisory firm, states: “Traditional modernization tends to over-index on protecting how things work today rather than building for what’s next. AI capability is compounding rapidly, and the real risk for mid-market companies is delay.”
That compounding dynamic means the gap between modernized and non-modernized organizations doesn’t hold steady. It widens.
What a Technical Debt Remediation Engagement Actually Looks Like
Before a CEO approves a modernization budget, they need to understand what they’re buying. Transparency about process is a precondition for trust — and most firms skip this part.
The diagnostic phase: quantifying debt before committing to a roadmap
The first step in any credible modernization engagement is a systems assessment. Not an engineering audit that produces a 200-page technical report. A CEO-readable diagnosis of:
- Which components carry the highest maintenance cost and represent the greatest delivery drag
- Where the architecture fails against AI-readiness requirements
- Which legacy components can be incrementally replaced, versus which need architectural rethinking
- What a phased roadmap looks like — in months to first ROI, not years to theoretical completion
A well-run diagnostic takes 2–4 weeks and produces a business case, not a code review. The output is a cost-versus-return model your CFO can evaluate, with a phased roadmap your CTO can defend.
The diagnostic phase exists for one reason: so that both parties understand what they’re committing to before the commitment is made.
Documentation transfer: why this is the risk control mechanism most firms skip
Every CEO who has worked with a development vendor has a version of the same story. The vendor delivered working software. The vendor left. Three months later, nobody can explain how a critical piece of the system works, and making a change requires calling the vendor back at consultant rates.
Documentation transfer isn’t a nice-to-have. It’s the mechanism that determines whether you own your system or whether you’re renting access to it.
A properly structured modernization engagement transfers the following to the client at project completion, unconditionally: UML architecture diagrams, system design documents, API references, test coverage reports, and architecture decision records explaining why key choices were made — not just what was built.
That documentation doesn’t just protect you from vendor dependency. It reduces onboarding time for new engineers, makes future iterations faster and less expensive, and serves as the foundation for AI integration when the architecture is ready to support it.
This is what makes the modernization ROI calculation permanent rather than one-time: you own the output. The cost savings compound forward because the system you own is documented, clean, and yours.
Building the ROI Case for Your Board
You’ve done the diagnosis. You understand the cost. Now you need to get the budget approved. The board presentation has three numbers, and they need to be stated in the right sequence.
The three numbers every board presentation needs
Number 1: Current annual cost of technical debt
Use the four-category framework from the calculation section above. Add direct maintenance proxy, velocity tax, recruiting premium, and deferred revenue estimate. This is the status quo cost — what continuing to do nothing costs per year in hard and soft terms.
Number 2: Modernization investment
This is the engagement cost for the recommended approach — specifically, the incremental AI-augmented path, not a full rewrite. Scoped as a phased roadmap with clear deliverables per phase.
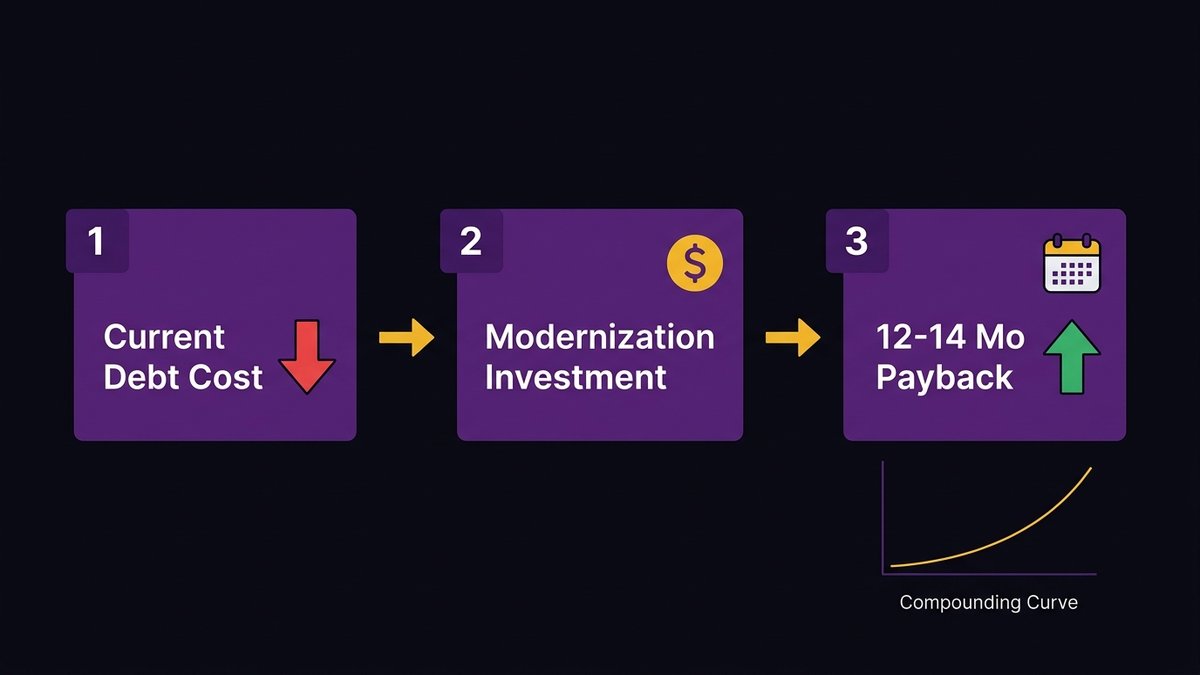
Number 3: Payback period and compounding return
Based on the UpdateCode.ai research: 12–14 months to positive ROI for incremental AI-augmented modernization. After the payback period, the cost reduction compounds. The AI-readiness unlock adds a revenue layer with its own return calculation.
The board argument writes itself: “We are currently spending $X per year on the cost of maintaining a system we no longer control. The alternative is a $Y investment that returns positive ROI in 12–14 months and eliminates the maintenance drag permanently. We are not being asked to spend more on technology. We are being asked to redirect an existing cost into an investment that pays for itself.”
How to frame the modernization investment against the current maintenance spend
The single most effective reframe for a board audience: don’t present modernization as an additional expenditure. Present it as a reallocation of the maintenance budget you’re already spending.
If your IT budget is $5 million and 65% goes to maintenance, you’re already spending $3.25 million per year to maintain a system that’s limiting your growth. A modernization engagement that costs $1.5 million over 18 months and redirects that maintenance spend toward new capability isn’t an expense increase. It’s a budget reallocation with a 12–14-month payback and a permanent reduction in the annual maintenance cost line.
The argument isn’t “invest in technology.” It’s “stop getting charged for a system you’ll never get.”
If you want to run the diagnostic before building your board case, start with a technical debt assessment.
Ready to build your board case? Nexa Devs runs a technical debt diagnostic that produces a CEO-readable cost model and phased modernization roadmap, before you commit to anything. Book a diagnostic conversation
FAQ
What is the KPI for technical debt, and how do I present it to a CFO?
The most effective KPI for a CFO is maintenance spend as a percentage of total IT budget. If that number exceeds 60%, you have a quantifiable problem. Pair it with delivery velocity data and a deferred revenue estimate for one initiative blocked by technical debt to frame it as a business cost, not a development problem.
How do I calculate the ROI of paying down technical debt?
Use four cost categories: direct maintenance spend, velocity tax on engineering capacity, recruiting premium for legacy stack talent, and deferred revenue from delayed features. Add those figures to get your annual debt cost. Compare against modernization investment and a 12–14 month payback period benchmark for incremental AI-augmented approaches.
Why does technical debt block AI adoption?
AI systems need real-time data access, API-first interfaces, and modular architecture — three properties legacy systems lack. According to IBM’s Institute for Business Value, technical debt can reduce AI ROI by 18–29% even in high-priority projects. Legacy architecture built for batch processing can’t support AI integration without significant rearchitecting.
What is the difference between incremental modernization and a full rewrite?
A full rewrite replaces the entire system from scratch over 24–48 months. Incremental modernization replaces the highest-cost components first without stopping the existing system. Full rewrites take 36–48 months to positive ROI; incremental AI-augmented modernization reaches it in 12–14 months, with lower business risk throughout.
How much of our IT budget should go to new development versus maintenance?
Leading firms allocate approximately 15% of IT budgets to proactive debt remediation. A healthy allocation runs roughly 40–60% maintenance, 40–60% innovation. Mid-market organizations with legacy systems often run at 65–80% maintenance,
well outside that range. The goal is to reduce maintenance cost per IT dollar over time, not to hit a fixed ratio.